Released: June 5, 2013
Next Release: June 12, 2013
Key factors behind the recent narrowing in the Brent-WTI Spread
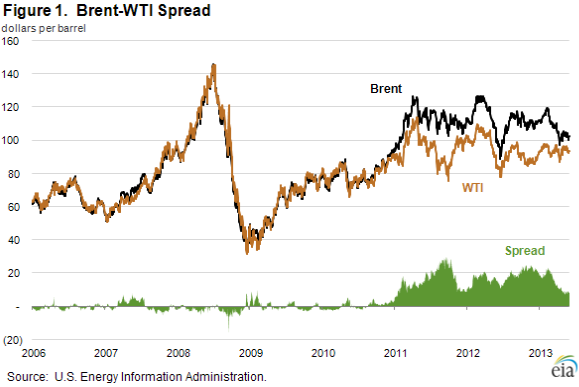
The Brent-WTI spread, the difference between the spot prices of Brent and West Texas Intermediate (WTI) crude oils, has narrowed considerably over the past several months. The spread, which was more than $23 per barrel in mid-February, fell to under $9 in April, and has ranged between $7 and $10 since then. The narrowing of the spread is supported by several factors that have depressed Brent prices or strengthened WTI prices, including the displacement of Brent-quality crude imports into North America by increased U.S. production that is flowing to refiners through expanded crude-by-rail and pipeline infrastructure, seasonal European refinery maintenance and tariff policy changes in South Korea.
Recent expansions in midstream crude oil infrastructure have eased downward pressure on the WTI price. Before mid-2012, only one 96,000-barrel-per-day (bbl/d) pipeline delivered crude oil from the Midwest to the Gulf Coast. Since then, significant new takeaway capacity from Cushing has come on line, starting with the 150,000-bbl/d Seaway Pipeline reversal in May 2012 and its 250,000-bbl/d expansion in January 2013. Sunoco's Permian Express Pipeline and the reversal of Magellan Midstream Partners' Longhorn Pipeline are expected to add 315,000 bbl/d of pipeline capacity that bypasses Cushing, taking Permian Basin crude directly to the Gulf Coast. These projects, along with an additional 760,000 bbl/d of pipeline capacity debottlenecking Cushing, are expected to come on line by the end of 2013.
With expanded pipeline and crude-by-rail capacity, competitively-priced U.S. crude oil production is backing out imports of Brent-like crude oil, especially crudes from Nigeria, Angola, and Algeria. In 2010, the U.S. imported 886,000 bbl/d of light sweet crude oil to the Gulf Coast; by March 2013, imports had fallen to less than 40,000 bbl/d. Crude-by-rail is also displacing imports on both the West and East coasts. In addition, U.S. crude oil exports to Canada have increased from an historical average of 24,000 bbl/d to 100,000 bbl/d over the first quarter of 2013, replacing Brent-quality crude imports to Canada's East Coast refineries. Taken together, these changes have diverted almost 1 million bbl/d of Brent-like crude away from North America into other regions of the global crude market.
Pending changes in tariff policy in South Korea, the world's third largest petroleum importer, are also affecting the demand for Brent crude. South Korea imposes a 3-percent tariff on crude oil imports but rebates the tariff if refined petroleum products are exported. Although the crude oil tariff is not levied on imports from countries that have a free trade agreement (FTA) with South Korea, the rebate has still been paid for exports of product, effectively providing a 3-percent subsidy to crude imports from FTA partner countries. According to trade press, South Korea's imports of crude oil from European Union (EU) member countries increased eight-fold since an FTA with the EU was signed in mid-2011. Beginning in July 2013, the rebate will no longer be paid for export volumes made from FTA crude imports, eliminating the implicit 3-percent subsidy. Downward pressure on Brent prices has possibly been mitigated by the very recent announcement that South Korea may incentivize refiners to process more Brent-price-based crude oil.
The future of the Brent-WTI spread will be determined in part by the balance between future growth in midcontinent crude production on the one hand and in midstream infrastructure to move that crude to refiners on the other. Over the next two years, about 2 million bbl/d of new or diverted pipeline takeaway capacity from Cushing to the Gulf Coast is planned, significantly more than the 1.2 million bbl/d of new incoming capacity. In its May 2013 Short-Term Energy Outlook EIA forecasts the Brent-WTI spread to average $13 per barrel in 2013 and decline to an average $9 per barrel in 2014.
Gasoline prices up slightly; diesel fuel down a penny
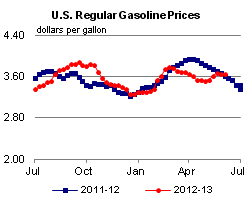
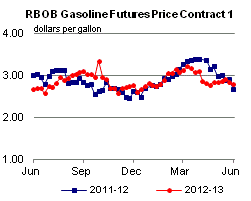
The U.S. average retail price of regular gasoline increased less than one cent to remain at $3.65 per gallon as of June 3, 2013, up three cents from last year at this time. The Midwest price increased six cents to $3.84 per gallon, while prices in the Rocky Mountains rose less than a cent to $3.73 per gallon. The largest decrease came on the West Coast, where the price dropped four cents to $3.89 per gallon. On the Gulf Coast, the price is $3.34 per gallon, a decline of three cents from last week. Rounding out the regions, the East Coast price fell two cents to $3.48 per gallon.
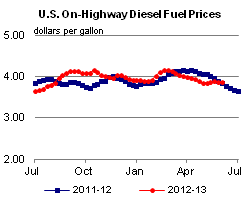
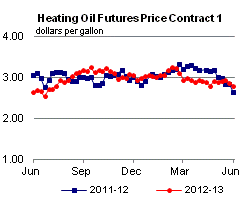
The national average diesel fuel price decreased one cent to $3.87 per gallon, two cents higher than last year at this time. The Rocky Mountain price increased less than a penny to $3.87 per gallon, while prices in all other regions fell. The Midwest and West Coast prices both declined two cents, to $3.90 and $3.97 per gallon, respectively. The East Coast and Gulf Coast prices both decreased one cent, to $3.86 and $3.77 per gallon, respectively.
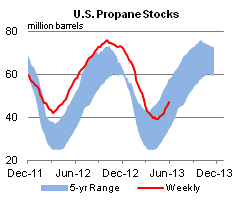
Propane inventories gain
Total U.S. inventories of propane increased 1.9 million barrels last week to end at 47.0 million barrels, but are 10.9 million barrels (18.8 percent) lower than the same period a year ago. The Midwest region led the gain with 1.3 million barrels, while East Coast stocks increased by 0.3 million barrels. Gulf Coast inventories increased by 0.2 million barrels, and Rocky Mountain/West Coast inventories gained by 0.1 million barrels. Propylene non-fuel-use inventories represented 6.6 percent of total propane inventories.
Text from the previous editions of This Week In Petroleum is accessible through a link at the top right-hand corner of this page.
 |
 |
||||||
| Retail Data | Change From Last | Retail Data | Change From Last | ||||
| 06/03/13 | Week | Year | 06/03/13 | Week | Year | ||
| Gasoline | 3.646 | Diesel Fuel | 3.869 | ||||
 |
 |
||||||||||||||||||||||||||
|
 |
||||||||||||||||||||||||||
| *Note: Crude Oil Price in Dollars per Barrel. | |||||||||||||||||||||||||||
 |
 |
||||||
 |
 |
||||||
| Stocks Data | Change From Last | Stocks Data | Change From Last | ||||
| 05/31/13 | Week | Year | 05/31/13 | Week | Year | ||
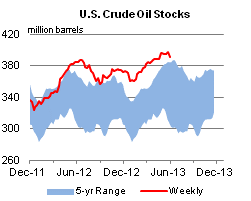
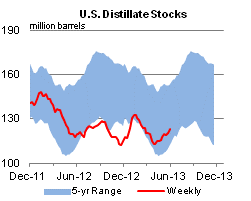
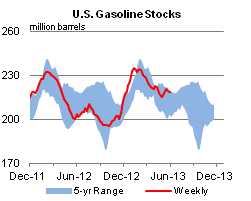
| Crude Oil | 391.3 | Distillate | 123.3 | ||||
| Gasoline | 218.8 | Propane | 47.036 | ||||