
Short-term, real-time power prices reflect system strain during Northeast heat wave
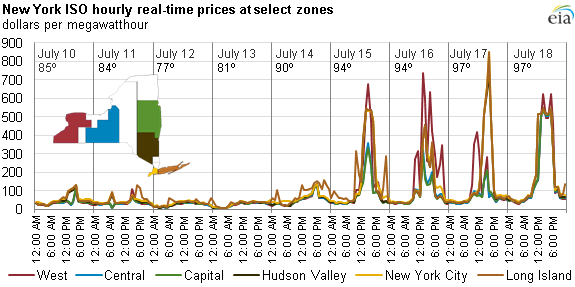
The first sustained heat wave of summer 2013 in the Northeast hit this week and electric systems in New England, New York, and across the Mid-Atlantic region are contending with the stress of meeting elevated demand levels for electricity to cool homes and workplaces amid high temperatures and humidity. Daily temperatures in these regions reached highs in the upper 90s. Real-time electric power prices in the New York Independent System Operator area peaked at more than $800 per megawatthour (MWh) on July 17 in New York City.
Extensive operating and market information publicly available on regional transmission organization (RTO) websites allows market participants to track the effects of the heat wave in real-time and examine the data in more detail after the fact.
High real-time power prices are an indicator of electric system stress. System operators must maintain a balance of supply and demand continuously. As demand rises and then falls over a day, operators bring on and take off generators so that supply matches demand. However, system conditions rarely match perfectly the forecast requirements from the day before, so RTOs run models every five minutes to highlight needed adjustments. This model produces real-time locational marginal prices, or LMPs. The averages of the five-minute LMPs form the average hourly, real-time prices shown in the chart above.
The three RTOs in the Mid-Atlantic and Northeast are the PJM Interconnection (PJM), the New York Independent System Operator (NYISO), and the ISO New England (ISO-NE). The publicly available operating and price information provides a fairly detailed picture of the level of electric system stress that must be managed by system operators during heat waves.
EIA posted Northeastern Summer Electricity Market Alerts on July 17 through today with information on electricity and natural gas prices, as well as forecast, peak electricity demand, and weather information.