Northeastern Winter Energy Alert
Release date: January 22, 2018
Market design changes and winter preparedness actions help Northeast and Mid-Atlantic electricity markets handle January’s bomb cyclone weather event
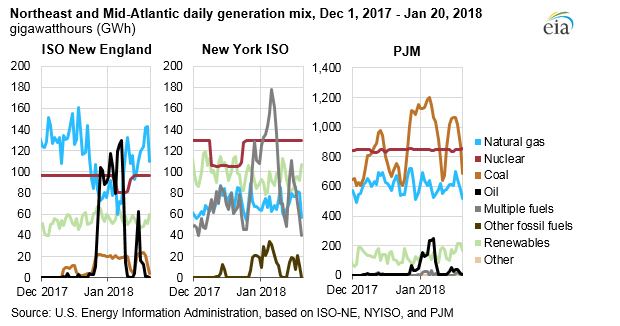
The intensely cold bomb cyclone weather event in early January resulted in record levels of U.S. natural gas demand and elevated wholesale natural gas and power prices around the country. A constrained natural gas pipeline network led to a significant increase in oil-fired and dual-fuel generation in New England and New York and, to a lesser extent, in the Mid-Atlantic.
During the cold weather spanning the end of December to early January, oil use jumped from almost nothing to a high of 36% of the daily generation mix on the ISO New England (ISO-NE) system and 9% on the PJM system covering an extended Mid-Atlantic region. On New York ISO’s (NYISO) system, the output of dual-fuel generators, most of which are natural gas generators that can switch to oil, and other fossil fuel generators rose significantly. Coal generation also increased substantially in PJM.
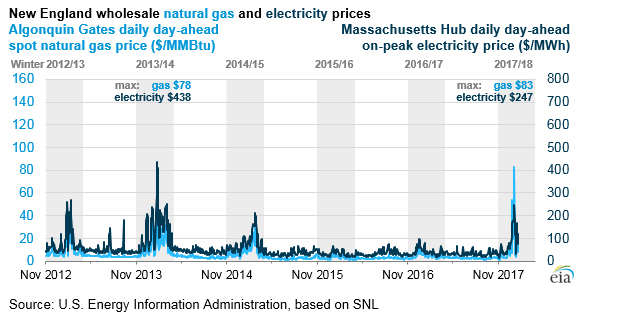
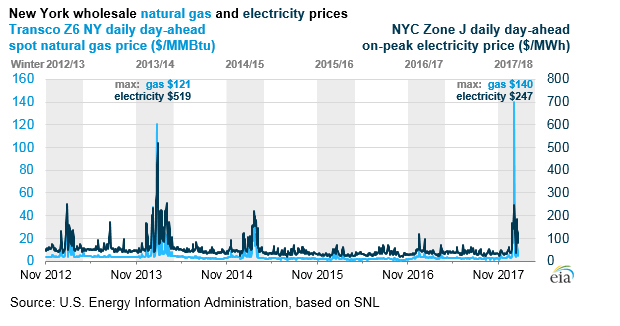
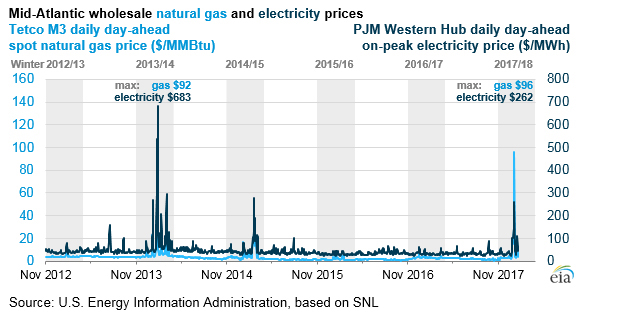
Day-ahead daily average peak-period power prices for January 5, 2018, one of the coldest days of the weather event, reached $247 per megawatthour (MWh) in New England and New York and $262/MWh in the Mid-Atlantic, compared with $30-$50/MWh average prices in the preceding six weeks. These prices were far lower than the $440-$680/MWh peaks seen during the polar vortex event in January 2014 despite natural gas prices that spiked higher this year than in 2014.
Day-ahead natural gas spot prices for January 5, 2018, reached $83.75 per million British thermal units (MMBtu) in New England, $140.25/MMBtu in New York, and $96.07/MMBtu in the Mid-Atlantic, compared with $3-$5/MMbtu average prices in the preceding six weeks. These prices exceeded January 2014 polar vortex prices by about $4-20/MMBtu.
Power markets in the Northeast and Mid-Atlantic have become more reliant on natural gas over the past several years following the retirement of electricity generators using fuels other than natural gas. However, the relative moderation in power price spikes during this year’s cold snap—despite higher natural gas prices—reflects a host of market rule changes and winter preparedness actions taken by the region’s grid operators to improve winter reliability.
New England
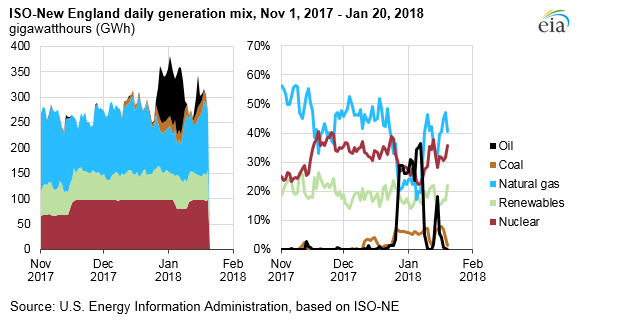
In New England, retirements of the Vermont Yankee nuclear plant, the Brayton Point coal plant, and the Salem Harbor coal- and oil-fired plant (which is currently being converted to natural gas), as well as incremental expansions of the natural gas pipeline network, have led the region to become more reliant on natural gas over the past couple years.
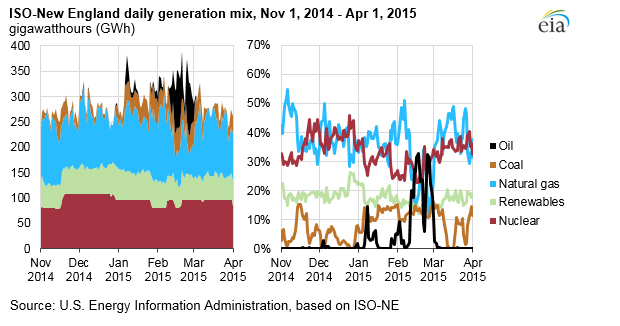
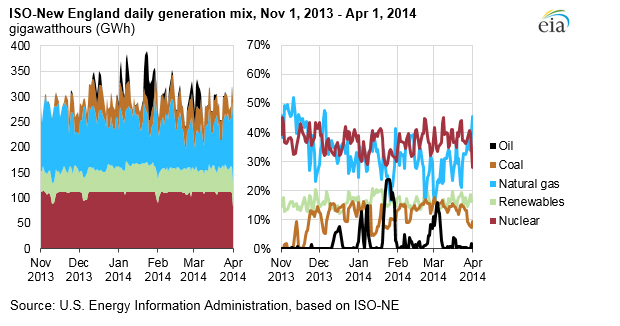
During the 12-day span from December 28, 2017, to January 8, 2018, oil and coal made up on average 29% and 6%, respectively, of ISO-NE’s generation mix. Natural gas dropped at one point to a low of 17% of generation. One of the region’s three nuclear plants, Pilgrim, experienced an unexpected outage for six days during that period. Dual-fuel reporting changes in late 2014 make direct comparisons to the polar vortex (2013-14) generation mix difficult, but oil provided similar contributions during the 2014-15 winter for shorter stretches of time.
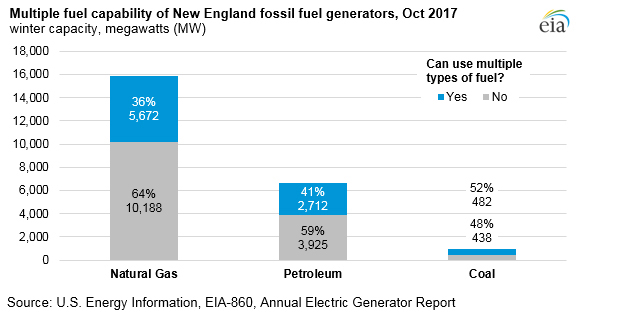
ISO-NE’s Winter Reliability Program, implemented after the polar vortex, has incentivized generators to procure adequate onsite fuel supplies for winter and spurred 1,774 MW of natural gas-fired generators to add dual-fuel capability, which allows them to switch fuels or co-fire multiple fuels simultaneously. More than one-third of New England’s natural gas capacity has dual-fuel capability with oil as their secondary source, while about 40% of oil capacity can switch to natural gas, and about 50% of coal capacity can switch mainly to oil.
ISO-NE has also made market design changes to improve winter reliability, including allowing generators to submit and update supply offers for each hour of the day as opposed to a single supply offer for an entire day. Dual-fuel generators can now specify the percentage of fuels they plan to use and the costs for each fuel. These changes allow generators to offer their resources into the market with more accurate representations of their operating costs.
Other parts of ISO-NE’s winter preparedness initiative include adjusting the daily timeline of their day-ahead market clearing process to better align with day-ahead natural gas procurement timelines, requiring dual-fuel testing, and increasing real-time communication with natural gas pipeline operators and generators about the status of fuel supplies and potential outages.
New York
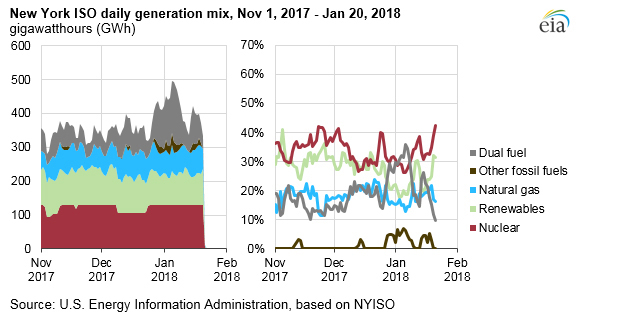
During the 12-day period from December 28 to January 8, dual-fuel generators burning oil and natural gas accounted for, on average, 30% of NYISO’s generation mix, while coal and oil-only generators together averaged 5%. The breakout by fuel for dual-fuel generators is not currently reported. Nuclear generators provided roughly 30% while natural gas–only and renewables provided the remaining 35%.
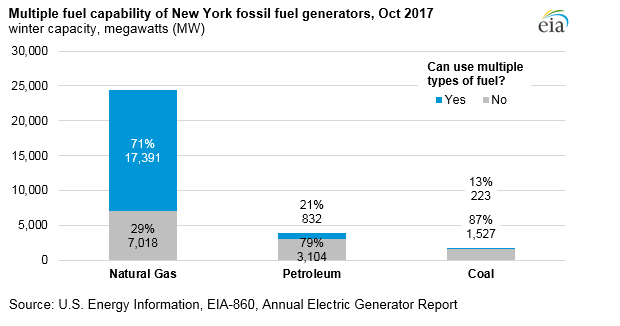
In New York, natural gas makes up more than half of the state’s total generating capacity with about 70% of natural gas capacity able to switch to oil. About 20% of oil capacity can switch to natural gas and 13% of coal capacity can switch to oil or natural gas.
NYISO has taken actions similar to ISO-NE to improve winter reliability. The grid operator increased generator fuel surveys and site visits, made use of generators with higher-priced offers when units committed in the day-ahead market could not run, and developed a streamlined process with New York state agencies for generators to request temporary emission waivers if needed for reliability.
NYISO made several market design changes including increasing the system’s total operating reserve requirement from 1,965 MW to 2,620 MW and implementing new pricing methodologies that allow energy and ancillary service prices to rise higher to more accurately reflect costs for maintaining reliability, especially during reduced supply periods.
PJM
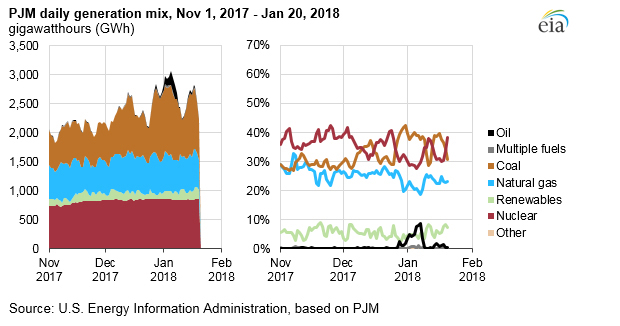
PJM is a much larger system that relies on natural gas to a lesser extent than ISO-NE and NYISO. Oil generation peaked at 9% of the generation mix on January 7 and averaged 4% during the 12-day period from December 28 to January 8. Coal generation, which hovered around 30% of the generation mix beforehand, grew to about 40% during the same time period.
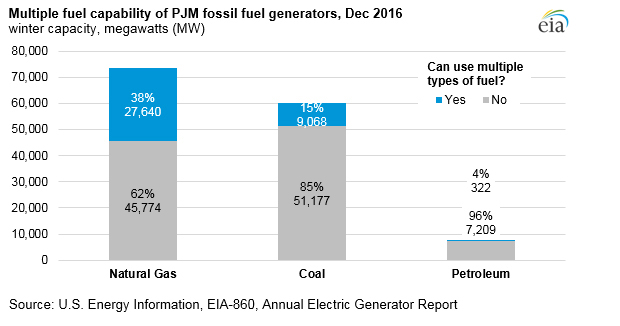
About 40% of PJM’s natural gas generators can switch, mainly to oil, while 15% of coal capacity can switch to natural gas or oil, and 4% of oil capacity can switch mainly to natural gas.
PJM has improved its winter readiness by conducting fuel inventory surveys, cold weather exercises, emergency drills, generator testing and training, and increasing communication with natural gas pipeline operators and generators.
Prompted by the unprecedented amount of generator and equipment outages during the January 2014 polar vortex, PJM has gradually transitioned over the past couple years to new capacity market rules under its Capacity Performance proposal that increase capacity payments to generators while also imposing strict penalties for not performing when called upon by the grid operator during emergency events. These changes are intended to incentivize generators to invest in equipment maintenance and adequate fuel supplies to reduce generator non-performance.