U.S. Energy Information Administration logo
Skip to sub-navigation
June 25, 2013

Average U.S. residential summer 2013 electric bill expected to be lowest in four years
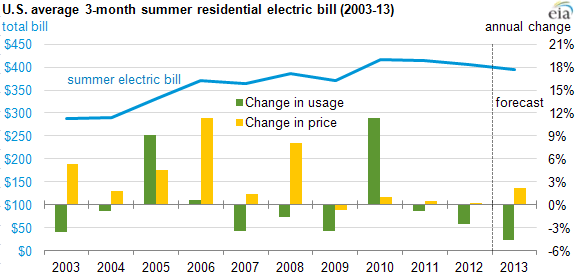
graph of U.S. average summer electricity bills, as explained in the article text
Source: U.S. Energy Information Administration, Summer 2013 Outlook for Residential Electric Bills, June 11, 2013.
Note: Summer residential bill amount measured in nominal dollars for the 3-month period June-August of each year.

The average U.S. household electric bill for June through August is expected to total $395, down 2.5% from last summer and the cheapest in four years. Slightly higher electricity prices are expected to be offset by a drop in electricity use to meet lower cooling demand due to forecast milder temperatures this summer compared to last year's hotter than normal summer.

Average electricity demand is expected to be down 4.6% this summer, while average retail electricity prices are expected to increase 2.2%, according to the EIA's June Short-Term Energy Outlook. The result is lower power bills for most U.S. households during June, July, and August, when air conditioning is used the most.

Retail electricity expenses vary by region (see map below). EIA expects residential summer power bills will be lower in all areas of the country, except for the West South Central region and the Rocky Mountain states, where increased electricity prices will outweigh expected lower power consumption.

Temperature changes will have the biggest effect on summer electric bills. A warmer-than-expected summer would likely move power prices higher, as more homes have air conditioning. The percentage of U.S. households with installed air conditioning equipment jumped from 68% in 1993 to 87% in 2009, based on the most recent data from the EIA's Residential Energy Consumption Survey. The boost in air conditioning use reflects a U.S. population shift during this period to warmer and more humid areas of the country.

Wholesale electric power prices have increased significantly from last year's lows, but state retail rate regulation shields customers from price swings in the wholesale power market.
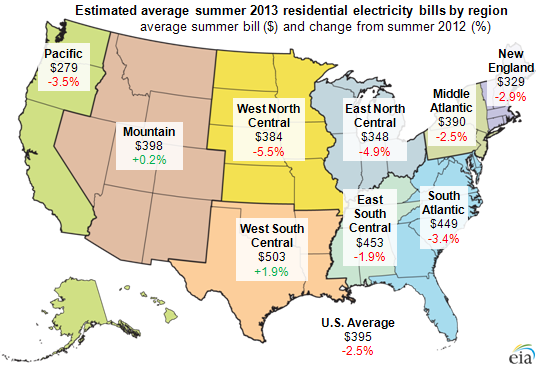
map of average electricity bills by region, as explained in the article text
Source: U.S. Energy Information Administration, Summer 2013 Outlook for Residential Electric Bills, June 11, 2013.

Statistics
Analysis
Tools
Education
News

Petroleum & Other Liquids

Crude oil, gasoline, heating oil, diesel, propane, and other liquids including biofuels and natural gas liquids.

Natural Gas

Exploration and reserves, storage, imports and exports, production, prices, sales.

Electricity

Sales, revenue and prices, power plants, fuel use, stocks, generation, trade, demand & emissions.

Coal

Reserves, production, prices, employment and productivity, distribution, stocks, imports and exports.

Nuclear & Uranium

Uranium fuel, nuclear reactors, generation, spent fuel.

Renewable & Alternative Fuels

Includes hydropower, solar, wind, geothermal, biomass and ethanol.

EIA Survey Forms

Forms EIA uses to collect energy data including descriptions, links to survey instructions, and additional information.

Total Energy

Comprehensive data summaries, comparisons, analysis, and projections integrated across all energy sources.

U.S. States

State energy information, including overviews, rankings, data, and analyses.

International

International energy information, including overviews, rankings, data, and analyses.

Environment

Greenhouse gas data, voluntary reporting, electric power plant emissions.

Data Tools, Apps, & Maps

Tools to customize searches, view specific data sets, study detailed documentation, and access time-series data.

Open Data

EIA's free and open data available as API, Excel add-in, bulk files, and widgets

EIA Beta

Come test out some of the products still in development and let us know what you think!

Open Source Code

EIA's open source code, available on GitHub.

RSS Feeds

Subscribe to feeds for updates on EIA products including Today in Energy and What's New.