2009 RECS Survey Data 2024 | 2020 | 2015 |2009 | 2005 | 2001 | 1997 | 1993 | Previous
- Housing characteristics
- Consumption & expenditures
- Microdata
- Methodology
Housing characteristics tables
+ EXPAND ALL
| Fuels used & end uses | |
|---|---|
| Preliminary release date: March 28, 2011 Final release date: May 6, 2013 |
ZIP (all tables) |
| by Type of housing unit (HC1.1) | XLS |
| by Owner-renter (HC1.2) | XLS |
| by Year of construction (HC1.3) | XLS |
| by Number of household members (HC1.4) | XLS |
| by Household income (HC1.5) | XLS |
| by Climate region (HC1.6) | XLS |
| by Census regions (HC1.7) | XLS |
| in Northeast Region, divisions, and states (HC1.8) | XLS |
| in Midwest Region, divisions, and states (HC1.9) | XLS |
| in South Region, divisions, and states (HC1.10) | XLS |
| in West Region, divisions, and states (HC1.11) | XLS |
| Structural and geographic characteristics | Preliminary release date: March 28, 2011 Final release date: May 6, 2013 |
ZIP (all tables) |
| by Type of housing unit (HC2.1) | XLS |
| by Owner-renter (HC2.2.) | XLS |
| by Year of construction (HC2.3) | XLS |
| by Number of household members (HC2.4) | XLS |
| by Household income (HC2.5) | XLS |
| by Climate region (HC2.6) | XLS |
| by Census region (HC2.7) | XLS |
| in Northeast Region, divisions, and states (HC2.8) | XLS |
| in Midwest Region, divisions, and states (HC2.9) | XLS |
| in South Region, divisions, and states (HC2.10) | XLS |
| in Western Region, divisions, and states (HC2.11) | XLS |
| Appliances | Preliminary release date: March 28, 2011 Final release date: May 6, 2013 |
ZIP (all tables) |
| by Type of housing unit(HC3.1) | XLS |
| by Owner-renter (HC3.2) | XLS |
| by Year of construction (HC3.3) | XLS |
| by Number of household members (HC3.4) | XLS |
| by Household income (HC3.5) | XLS |
| by Climate region (HC3.6) | XLS |
| by Census region (HC3.7) | XLS |
| in Northeast Region, divisions, and states (HC3.8) | XLS |
| in Midwest Region, divisions, and states (HC3.9) | XLS |
| in South Regions, divisions, and states (HC3.10) | XLS |
| in West Region, divisions, and states (HC3.11) | XLS |
| Televisions | Preliminary release date: March 28, 2011 Final release date: May 6, 2013 |
ZIP (all tables) | by Type of housing unit (HC4.1) | XLS |
| by Owner-renter (HC4.2) | XLS |
| by Year of construction (HC4.3) | XLS |
| by Number of household members (HC4.4) | XLS |
| by Household income (HC4.5) | XLS |
| by Climate region (HC4.6) | XLS |
| by Census region (HC4.7) | XLS |
| in Northeast Region, divisions, and states (HC4.8) | XLS |
| in Midwest Regions, divisions, and states (HC4.9) | XLS |
| in South Regions, divisions, and states (HC4.10) | XLS |
| in West Regions, divisions, and states (HC4.11) | XLS |
| Computers & other electronics | Preliminary release date: March 28, 2011 Final release date: May 6, 2013 |
ZIP (all tables) |
| by Type of housing unit(HC5.1) | XLS |
| by Owner-renter (HC5.2) | XLS |
| by Year of construction (HC5.3) | XLS |
| by Number of household members (HC5.4) | XLS |
| by Household income (HC5.5) | XLS |
| by Climate region (HC5.6) | XLS |
| by Census region (HC5.7) | XLS |
| in Northeast Region, divisions, and states (HC5.8) | XLS |
| in Midwest Region, divisions, and states (HC5.9) | XLS |
| in South Region, divisions, and states (HC5.10) | XLS |
| in West Region, divisions, and states (HC5.11) | XLS |
| Space heating | Preliminary release date: August 19, 2011 Final release date: May 6, 2013 |
ZIP (all tables) |
| by Type of housing unit(HC6.1) | XLS |
| by Owner-renter (HC6.2) | XLS |
| by Year of construction (HC6.3) | XLS |
| by Number of household members (HC6.4) | XLS |
| by Household income (HC6.5) | XLS |
| by Climate region (HC6.6) | XLS |
| by Census region (HC6.7) | XLS |
| in Northeast Region, divisions, and states (HC6.8) | XLS |
| in Midwest Region, divisions, and states (HC6.9) | XLS |
| in South Region, divisions, and states (HC6.10) | XLS |
| in West Region, divisions, and states (HC6.11) | XLS |
| Air conditioning | Preliminary release date: August 19, 2011 Final release date: May 6, 2013 |
ZIP (all tables) |
| by Type of housing unit (HC7.1) | XLS |
| by Owner-renter (HC7.2) | XLS |
| by Year of construction (HC7.3) | XLS |
| by Number of household members (HC7.4) | XLS |
| by Household income (HC7.5) | XLS |
| by Climate region (HC7.6) | XLS |
| by Census region (HC7.7) | XLS |
| in Northeast Region, divisions, and states (HC7.8) | XLS |
| in Midwest Region, divisions, and states (HC7.9) | XLS |
| in South Region, divisions, and states (HC7.10) | XLS |
| in West Region, divisions, and states (HC7.11) | XLS |
| Water heating | Preliminary release date: August 19, 2011 Final release date: May 6, 2013 |
ZIP (all tables) |
| by Type of Housing unit(HC8.1) | XLS |
| by Owner-renter (HC8.2) | XLS |
| by Year of construction (HC8.3) | XLS |
| by Number of household members (HC8.4) | XLS |
| by Household income (HC8.5) | XLS |
| by Climate region (HC8.6) | XLS |
| by Census region (HC8.7) | XLS |
| in Northeast Region, divisions, and states (HC8.8) | XLS |
| in Midwest Region, divisions, and states (HC8.9) | XLS |
| in South Region, divisions, and states (HC8.10) | XLS |
| in West Region, divisions, and states (HC8.11) | XLS |
| Household demographics | Preliminary release date: August 19, 2011 Final release date: May 6, 2013 |
ZIP (all tables) |
| by Type of housing unit(HC9.1) | XLS |
| by Owner-renter (HC9.2) | XLS |
| by Year of construction (HC9.3) | XLS |
| by Number of household members (HC9.4) | XLS |
| by Household income (HC9.5) | XLS |
| by Climate region (HC9.6) | XLS |
| by Census region (HC9.7) | XLS |
| in Northeast Region, divisions, and states (HC9.8) | XLS |
| in Midwest Region, divisions, and states (HC9.9) | XLS |
| in South Region, divisions, and states (HC9.10) | XLS |
| in West Region, divisions, and states (HC9.11) | XLS |
| Square footage (housing unit size) | Preliminary release date: April 19, 2012 Final release date: May 6, 2013 |
ZIP (all tables) |
| Total square footage (includes percents tab) | |
| Total square footage of U.S. homes (HC10.1) | XLS |
| Total square footage of Northeast homes (HC10.2) | XLS |
| Total square footage of Midwest homes (HC10.3) | XLS |
| Total Square footage of South homes (HC10.4) | XLS |
| Total square footage of West homes (HC10.5) | XLS |
| Total square footage of single-family homes (HC10.6) | XLS |
| Total square footage of multi-family homes (HC10.7) | XLS |
| Total square footage of mobile homes (HC10.8) | XLS |
| Average square footage | |
| Average square footage of U.S. homes (HC10.9) | XLS |
| Average square footage of Northeast homes (HC10.10) | XLS |
| Average square footage of Midwest homes (HC10.11) | XLS |
| Average square footage of South homes (HC10.12) | XLS |
| Average square footage of West homes (HC10.13) | XLS |
| Average Square footage of single-family homes (HC10.14) | XLS |
| Average square footage of multi-family homes (HC10.15) | XLS |
| Average square footage of mobile homes (HC10.16) | XLS |
| Special tabulations: wood characteristics and consumption | |
| Release date: February 21, 2014 | |
| CE5.1 Wood types used | XLS |
| CE5.2 Household wood consumption | XLS |
Background Information
RECS Status
The initial housing characteristics tables from the 2024 RECS data are now available.
RECS Dashboard
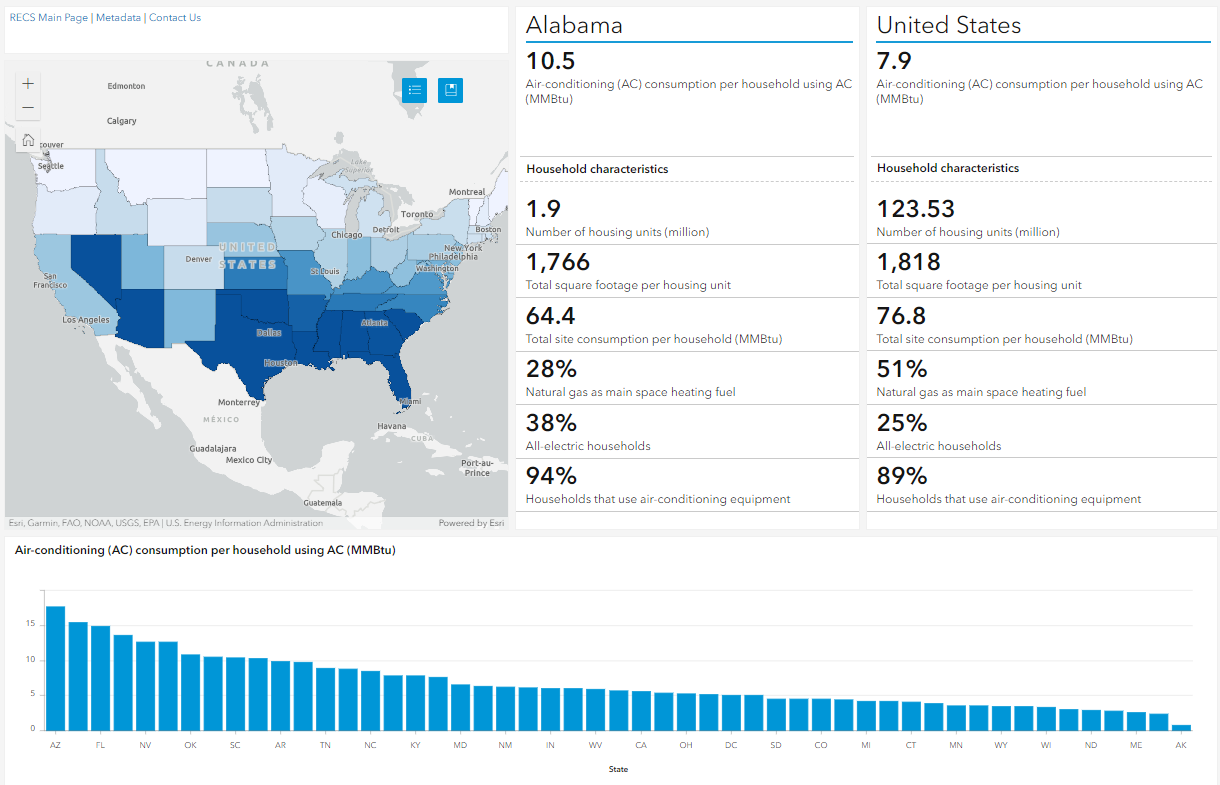 View the dashboard ›

