1993 RECS Survey Data 2020 | 2015 |2009 | 2005 | 2001 | 1997 | 1993 | Previous
- Housing characteristics
- Consumption & expenditures
- Microdata
- Methodology
Housing Characteristics Tables
| Topical Sections | Entire Section |
|---|---|
| All Detailed Tables | |
| Tables: HC1 Household Characteristics, Million U.S. Households Presents data relating to location, type, ownership, age, size, construction, and householder demographic and income characteristics. |
|
| Tables: HC2 Space Heating, Million U.S. Households Presents data describing the types of heating fuel and equipment used for main and secondary heating purposes. |
|
| Tables: HC3 Air-Conditioning, Million U.S. Households Presents data describing selected household characteristics including location, number of rooms and area cooled and air-conditioning usage. |
|
| Tables: HC4 Appliances, Million U.S. Households Presents data describing the frequency and characteristics of energy-intensive appliances found in most households. |
|
| Tables: HC5 Light Usage, Million U.S. Households Presents data describing the number and usage of incandescent and fluorescent indoor lights and outdoor lights. |
|
| Tables: HC6 Usage Indicators, Million U.S. Households Presents data describing usage of heating and cooling equipment, including thermostat settings at various times of the day, equipment using hot water, and cooking appliances. |
|
| Tables: HC7 Conservation, Million U.S. Households Presents data describing conservation measures taken by the household, participation in demand-side management programs, and types of windows in the housing unit. |
|
| Tables: HC8 Equipment Purchase, Million U.S. Households Presents data describing the purchase and replacement of heating and cooling equipment, refrigerators, and water heaters in the past 4 years and purchase considerations such as price and energy efficiency. |
Within each section, except for Air-conditioning and Light Usage, four sets of tables are presented. Each set of tables is comprised of data presented in terms of counts of millions of U.S. households and in terms of percent of U.S. households. Each count table is paired with its comparable percent table so that for each topic or variable counts are presented on the left-hand page and percentages presented on the facing right-hand page. The four sets of tables are entitled:
- Census Region and Climate Zone
- Year of Construction
- Type and Ownership of Housing Unit
- Family Income.
In addition to the four sets of tables listed above, the Household Characteristics and Space Heating sections also include tables that present data as a function of average and total floorspace. The three tables in the Air-conditioning tables use a unique format that presents data as a function of cooled floorspace and air-conditioning usage. Finally, the Light Usage section includes a table that describes indoor light usage by type of bulb. This section does not present data by the Year of Construction and Family Income headings formats
Categories of Data in the Tables:
+ Column Categories
The column categories most commonly classify data by the four sets of headings described above. The following, listed in alphabetical order, are explanations of some of the column categories that may require clarification.
Below Poverty Line (100 Percent and 125 Percent)—Low income classifications to which certain households are assigned. "Below 100 percent of poverty line includes households with incomes below the poverty level as defined by the U.S. Bureau of the Census and the Office of Management and Budget. "Below 125 percent of poverty" includes households with incomes below 125 percent of the poverty level. These groups of the poor and near-poor represent alternative levels for defining poverty. The poverty line varies with the number of family members in the household and the income of the entire family. (See Eligible for Federal Assistance below.)
Census Region—Four regions as defined by the U.S. Bureau of Census. For a map showing the four Census regions (and nine Census divisions), see Appendix E. For a listing of the States included in each Census region (and division), see the Glossary.
Climate Zone—One of five climatically distinct areas, defined by long-term weather conditions affecting the heating and cooling loads in buildings. The zones were developed by the Energy End Use and Integrated Statistics Division (EEUISD) from seven distinct climate categories originally identified by the American Institute of Architects (AIA) for the U.S. Department of Energy and the U.S. Department of Housing and Urban Development. The zones were determined according to the 30-year average (1961-1990) of the annual heating and cooling degree-days (base 65 degrees Fahrenheit). For additional details, see the Glossary.
Cooled Floorspace—Computed as heated floorspace times the percentage of rooms that are cooled over total rooms. If the housing unit has no heated floorspace then total floorspace is substituted for heated floorspace in the computation of cooled floorspace.
Cooling Degree-Days (CDD)—A measure of how hot a location was over a period of time, relative to a base temperature. In this report, the base temperature is 65 degrees Fahrenheit, and the period of time is 1 year. The cooing degree-days for a single day is the difference between that day's average temperature (the mean of the maximum and minimum temperature for a 24-hour period) and the base temperature if the daily average is greater than the base; it is zero if the daily average temperature is less than or equal to the base temperature.
Eligible for Federal Assistance—Households are categorized as eligible for federal energy assistance if their income is below the federal maximum standard. The Federal standard is 150 percent of the poverty line or 60 percent of statewide median income, whichever is the higher income. Individual States can set the standard at a lower level than the federal maximum. (See Below Poverty Line above.)
Family Income—The total combined income (before taxes and deductions) of all members of the family from all sources, for the 12 months prior to the interview. This definition includes the total income of all family members who lived in the household during the 12 months prior to the interview, regardless of whether they were living there at the time of the interview. For additional details, see Family Income Category in the Glossary.
Floorspace (square feet)—The floor area of the housing unit that is enclosed from the weather. Basements are included, whether or not they contain finished space. The finished space and the heated space in attics are included. Garages are included if they share a wall with the house. Crawl spaces, even if they are enclosed from the weather, are not included. Sheds and other buildings that are not attached to the house are not included.
Heated Floorspace—The portion of floorspace that is heated during most of the winter season. Rooms that are shut off during the heating season to save fuel are not counted as heated square footage. Attached garages that are unheated and unheated areas in basements and attics are not counted as heated floorspace.
Lights Used One or More Hours per Day—All the light bulbs controlled by one switch are counted as one light. For example, a chandelier with multiple lights controlled by one switch is counted as one light. A floor lamp with two separate bulbs controlled by two separate switches would be counted as two lights. Indoor and outdoor lights were counted only if they were under the control of the householder.
"Incandescent Lights" are the most common household lamps. Electricity runs through a tungsten filament that glows and produces a soft, warm light. Because so much of the energy used is lost as heat, these are highly inefficient sources of light. These common general-service bulbs emit light in all directions.
"Fluorescent Lights" are usually long, narrow, white tubes connected to a fixture at both ends of the lamp; some are circular tubes. The inner surface of the tube is coated with a material that fluoresces (emits visible light) when bombarded with secondary radiation generated by a gaseous discharge within the tube. These lights are typically found in kitchen and basement work areas. Newer types ("compact" fluorescent lamps), looking somewhat more like a conventional incandescent bulb, are being made, which can be screwed into fixtures.
Type and Ownership of Housing Unit—"Single-Family Housing Unit" is a unit that provides living space for one household or family. The structure may be detached or attached to another unit. Attached houses are considered single-family houses as long as the house itself is not divided into more than one housing unit and has an independent outside entrance. A single-family house is contained within walls that go from the basement or the ground floor (if there is no basement) to the roof. (A mobile home with one or more rooms added is classified as a single-family home.) Townhouses, rowhouses, and duplexes are considered single-family attached housing units, as long as there is no household living above another one within the walls that go from the basement to the roof to separate the units.
"Multifamily (two to four units)" is a housing unit in a building with two to four housing units—a structure that is divided into living quarters for two, three, or four families or households and in which one household lives above another. This category also includes houses originally intended for occupancy by one family (or for some other use) that have been converted into separate dwellings for two to four families. Typical arrangements in these types of living quarters are separate apartments downstairs and upstairs or one apartment on each of three or four floors.
"Multifamily (five or more units)" is a housing unit in a building with five or more housing units—a structure that is divided into living quarters for five or more families or households and in which one household lives above another.
"Mobile Home" is a housing unit built on a movable chassis and moved to the site. It may be placed on a permanent or temporary foundation and may contain one or more rooms. If rooms are added to the structure, it is considered a single-family housing unit. A manufactured house assembled on site is a single-family housing unit, not a mobile home.
"Owned/Rented" describes the relationship of a housing unit's occupants to the structure itself, not the land on which the structure is sited. "Owned" means the owner or co-owner is a member of the household and the housing unit is either fully paid for or mortgaged. A household is classified "rented" even if the rent is paid by someone not living in the unit. "Rent-free" means the unit is not owned and no money is paid or contracted for rent. Such units are usually provided in exchange for services rendered or as an allowance or favor from a relative or friend not living in the unit. Unless shown separately, rent-free households are grouped with rented households.
Year of Construction—The year the structure was originally completed or the year any part of the structure was first occupied. For mobile homes, year of construction is the model year.
+ Row Categories
The row categories classify data by specific features of the households as described by the section headings described above. All of the column categories already described also are employed as row categories. The large majority of the row categories presented are not particularly technical in nature, e.g., number and percent of color televisions in U.S. households. The Glossary provides detailed definitions of the more technical terms used as row categories.
Statistical Significance of Data
Row and Column Factors
The tables provide row factors in the far-right column and column factors on the top line of each table. These factors are to be used to determine the Relative Standard Error (RSE) for each estimate, which in turn can be used to determine the standard error and the confidence level of the estimate and to determine whether the difference between any two figures is statistically significant. However, since the RSE's are only approximate, standard errors, confidence intervals, and statistical tests must also be regarded as only approximate. For more details about the derivation of the row and column RSE factors, see Appendix B, "Quality of the Data."
To calculate the RSE for a specific estimate, multiply the row factor by the column factor, as illustrated in Figure 3.1, an excerpt from Table 3.1a of this report. This table shows that 10.2 million housing units in the Midwest were located in suburban areas. Multiplying 4.2 (the row factor) by 0.9 (the column factor) yields an approximate RSE of 3.8 percent.
Figure 3.1. Use of RSE Row and Column Factors
Table 3.1a. Household Characteristics by Census Region and Climate Zone, Million U.S. Households, 1993
 Source: Energy Information Administration, Office of Energy Markets and End Use, the 1993 Residential Energy Consumption Survey.
 Standard Errors
Since the estimates presented in the following tables are based on a sample of residential housing units, they are subject to sampling error, or standard error. To determine the standard error for an estimate in these tables, multiply the approximate RSE by the estimate. For example, to determine the standard error of 10.2 million housing units located in the suburbs of the Midwest in 1993, multiply 10.2 million housing units by .0378 (the approximate RSE). The result, 0.39 million housing units, is the approximate standard error for the estimate.
Confidence Levels:
+ Confidence Levels
For each of the estimates given in the tables, a 95-percent confidence range can be determined with the estimate at the mid-point. To calculate the 95-percent confidence range for a given figure:
- Multiply the RSE row factor by the RSE column factor to determine the approximate RSE.
- Multiply the approximate RSE (divided by 100) by the estimate given in the table to determine the approximate standard error.
- Multiply the result by 1.96 to determine approximate 2 standard errors.
- Subtract the result of Step 3 from the given estimate to determine the bottom of the range.
- Add the result of Step 3 to the given estimate to determine the top of the range.
The result of these steps will yield a range with the property that, in repeated surveys, the estimate would fall in the range constructed in this way 95 percent of the time.
For example, to determine the confidence range for the estimated 10.2 million midwestern housing units located in the suburbs in 1993:
- Multiply 4.2 (the RSE row factor) by 0.9 (the RSE column factor), which yields 3.78 percent (the approximate RSE).
- Multiply .0378 (the approximate RSE) by 10.2 million households (the estimate), which yields 0.4 million housing units (the approximate standard error).
- Multiply 0.4 million housing units by 1.96, which yields 0.8 million housing units (approximate 2 standard errors).
- To determine the bottom of the range, subtract 0.8 million housing units from 10.2 million housing units, which yields 9.4 million housing units.
To determine the top of the range, add 0.8 million housing units to 10.2 million housing units, which yields 11.0 million housing units.
It can then be said with 95-percent confidence that, in 1993, between 9.4 million and 11.0 million of the midwestern housing units were located in the suburbs. For each of the estimates......
+ Statistical Significance Between Two Statistics
The difference between any two estimates given in the detailed tables may or may not be statistically significant. Statistical significance for the difference between two independent variables is computed as:
where S is the standard error, x1 is the first estimate, and x2 is the second estimate. The result of this computation is to be multiplied by 1.96, and if this result is less than the difference between the two estimates, the difference is statistically significant.
For example, in 1993, 10.2 million of the midwestern housing units were located in the suburbs, while 6.4 million midwestern households were located in the central city, for an estimated difference of 3.8 million housing units. The standard error for the 10.2 million suburban housing units estimate (x1) is 0.39, and the standard error for the 6.4 million central city housing units estimate (x2) is 0.31:
Multiplying .50 by 1.96 yields 1.0 million housing units. Since 1.0 housing units is less than the 3.8 million housing units difference between the 1993 midwestern suburban and central city estimates, the difference is statistically significant.
Quick-Reference Guide
The Quick-Reference Guide below lists topical sections and table headings covered in the detailed tables and shows the table numbers for each of the tables. To assist the reader in locating a particular table, the topical section title is printed along the outside edge of each table page. The suffix "a" that accompanies the table number refers to the table that presents data in terms of counts of millions of U.S. households; the suffix "b" refers to the table that presents data in terms of the percent of U.S. households.
You have the option of downloading "all tables" or the tables that relate to each "topical section."
Specific questions on this product may be directed to:
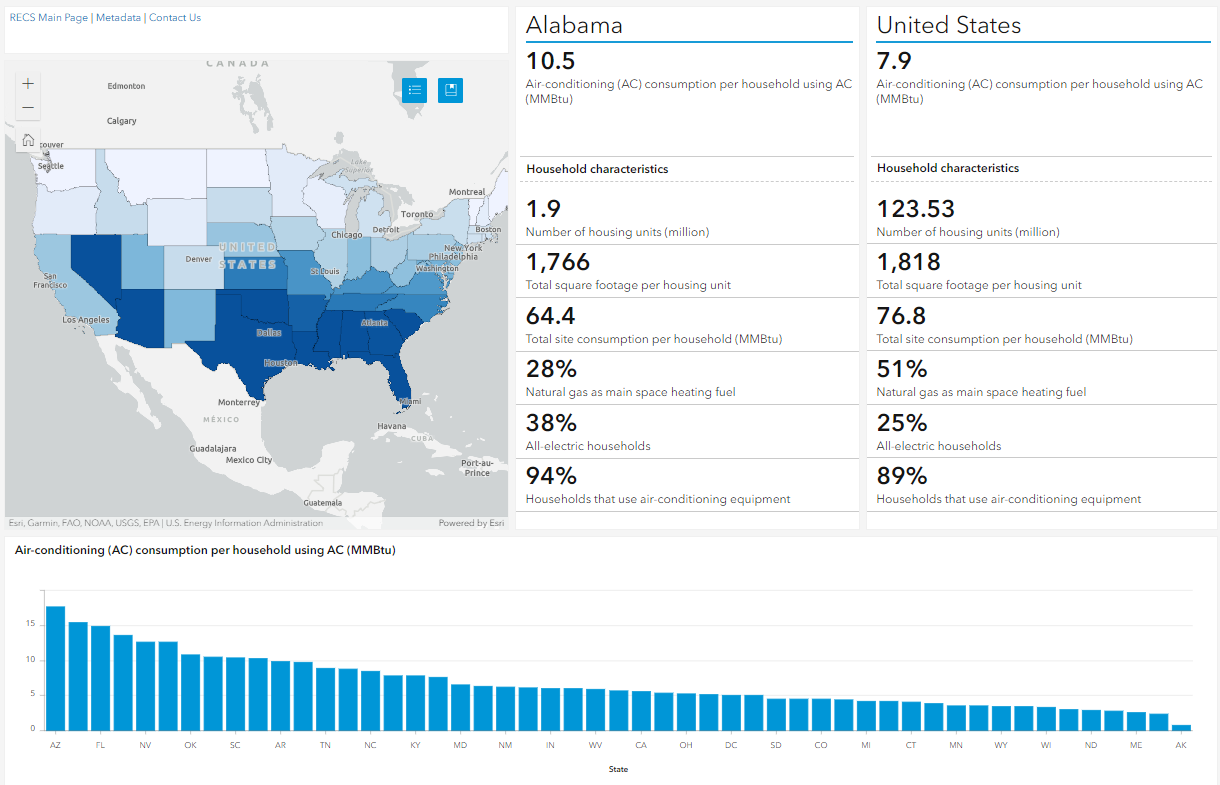 View the dashboard ›
