1997 RECS Survey Data 2020 | 2015 |2009 | 2005 | 2001 | 1997 | 1993 | Previous
- Housing characteristics
- Consumption & expenditures
- Microdata
- Methodology
Housing Characteristics Tables
| Table Titles (Released: February 2004) | Entire Section | Percents |
|---|---|---|
| Tables: HC1 Housing Unit Characteristics, Million U.S. Households | ||
| NOTE: As of 10/31/01, numbers in the "Housing Units" TABLES section for stub item: "Number of Floors in Apartment Buildings" were REVISED. These numbers will differ from the numbers in the published report. | ||
| Tables: HC2 Household Characteristics, Million U.S. Households | ||
| Tables: HC3 Space Heating, Million U.S. Households | ||
| Tables: HC4 Air-Conditioning, Million U.S. Households | ||
| Tables: HC5 Appliances, Million U.S. Households | ||
| Tables: HC6 Usage Indicators, Million U.S. Households | ||
| Tables: HC7 Home Office Equipment, Million U.S. Households | ||
Household Energy Usage
The 1997 Residential Energy Consumption Survey (RECS) collected household energy data for the four most populated States: California, Florida, New York, and Texas. Data for all the other States are aggregated and available at the Census Division (groups of 3 to 8 States) level.
For an overview of the energy-related characteristics and usage in each of the four most populated States, click on the State (in the left column).
For detailed data, choose from the tables listed below. Each table presents the pertinent information for each of the four States. All these data are from the 1997 RECS and are the most recent end-user household data.
Characteristics: Characteristics information about the housing unit and household are collected during on-site interviews at over 5,000 households across the United States.
| Characteristics and Percent Tables for the Four Most Populated States (CA, FL, NY, and TX) |
Characteristics
(Million U.S. Households) |
Percentages
(Percent of U.S. Households) |
|---|---|---|
| Tables: HC1 - Housing Unit Characteristics (Includes: housing type and ownership, year of construction, number of rooms, number of floors, heated floorspace, fuels used.) |
||
| Tables: HC2 - Household Characteristics (Includes: household income, age, race, household size, number of vehicles household owns.) |
||
| Tables: HC3 - Space Heating (Includes: space heating fuel, equipment used, equipment age, amount of heated floorspace, etc.) |
||
| Tables: HC4 - Air Conditioning (Includes: households using air- conditioning equipment, age of air-conditioning equipment, type of air-conditioning equipment.) |
||
| Tables: HC5 - Appliances (Includes: ovens, stoves, refrigerators, freezers, microwave, dishwashers, clothes washers and dryers, ceiling fans, TV's, heaters, heat pumps, water heaters.) |
||
| Tables: HC6 - Usage Indicators (Includes: indoor temperature settings, usage of appliances, usage of personal computers, household activities affecting energy usage.) |
||
| Tables: HC7 - Home Office Equipment (Includes: personal computers, modems, laser printers, FAX machines, copiers, office equipment indicators (personal, business, telecommuting.) |
Specific questions on this product may be directed to:
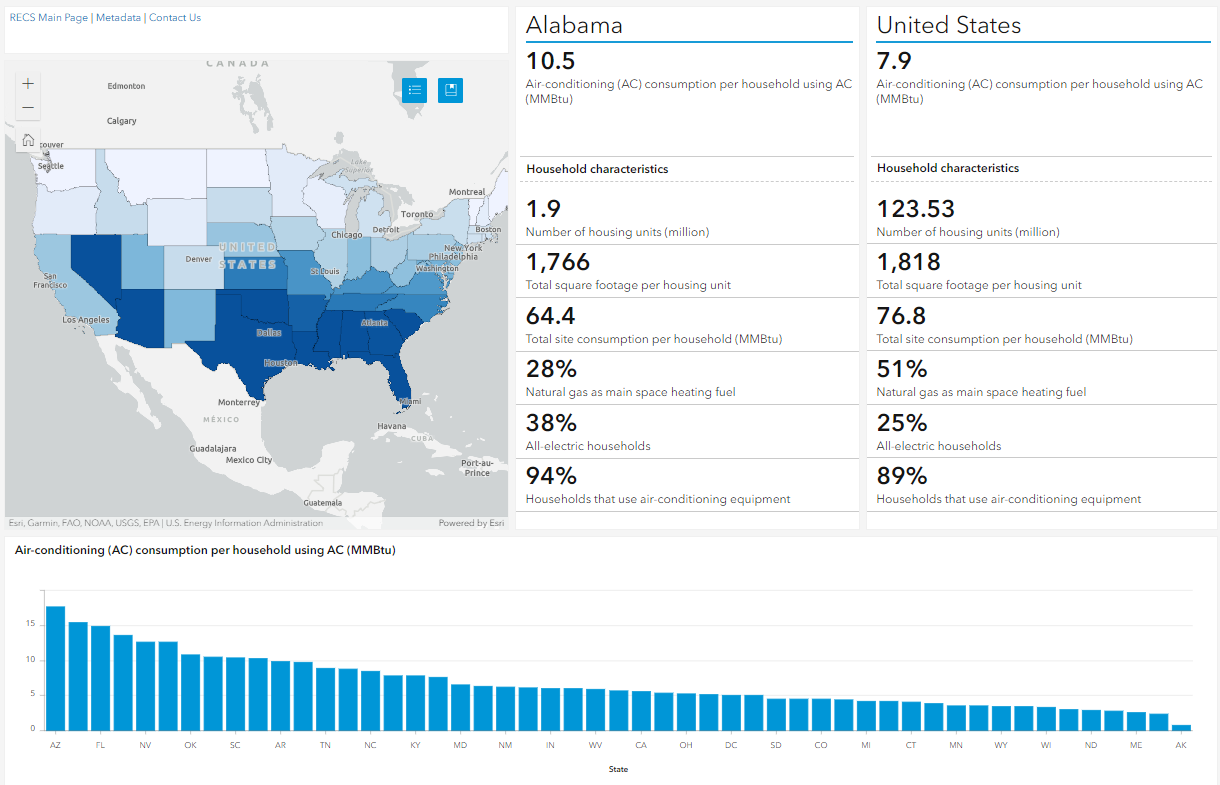 View the dashboard ›
