Hurricane effects on oil and natural gas production depend on storm trajectory, strength
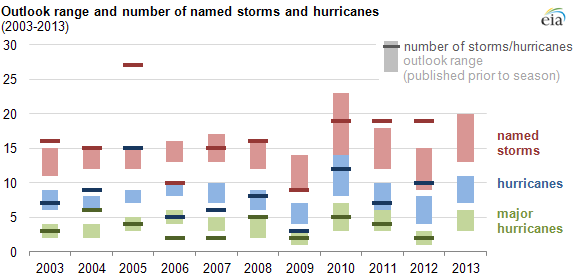
Note: NOAA classifies named storms as hurricanes when their maximum sustained surface wind exceeds 74 miles per hour, and major hurricanes when their maximum sustained surface wind exceeds 110 miles per hour.
Hurricane season starts tomorrow, and government weathercasters say there is a 70% chance of 13-20 named storms in the Atlantic Basin, of which 7-11 may strengthen to hurricanes and with 3-6 of those becoming major hurricanes characterized by wind categories 3, 4, and 5.
The National Oceanic and Atmospheric Administration's (NOAA) Climate Prediction Center released its forecast of summer storms last week. NOAA's forecast focuses on the number of storms but not their location or trajectory. For oil and natural gas production, the severity of any disruption largely depends on both the strength and location of the storms.
Storm disruptions to oil and natural gas production in the U.S. portion of the Gulf of Mexico (GOM) and along the Gulf Coast have declined in recent years because of regional shifts in where production takes place; there are now greater levels of production taking place at inland basins, which are generally less affected by storms.
For example, in 1997, 26% of the nation's natural gas was produced in the federal Gulf of Mexico; in 2012, that number was 6%. The GOM share of crude oil production also has declined, from 26% in 2007-11 to 19% last year.
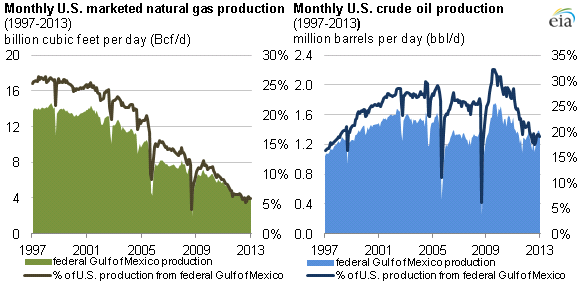
Note: Graph excludes state offshore volumes.
The likelihood of storms making landfall somewhere in the United States increases sharply during hyperactive seasons, when the Accumulated Cyclone Energy (ACE) index exceeds 165% of its 1981-2010 median value. For 2013, there is a 70% chance that the ACE range will be 120%-205% of this median, according to NOAA.
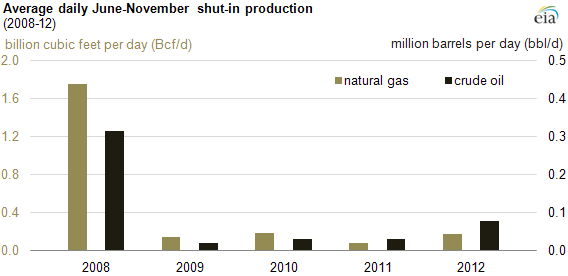
Making landfall, or not, is crucial to the effect on hydrocarbon production. For example:
- 2008: Two significant hurricanes affected oil and natural gas production in 2008: Hurricane Gustav, which made landfall in Cocodrie, Louisiana, on September 1, and Hurricane Ike, which made landfall in Galveston, Texas, on September 13. Both of these hurricanes caused considerable damage and led to an average 1.1 million barrels per day (bbl/d) of shut-in crude oil production and 5.5 billion cubic feet per day (Bcf/d) of shut-in natural gas production in September, according to EIA calculations.
- 2009-11: Storms during 2009-11 did not result in significant oil and natural production shut-ins. No hurricanes made landfall in the United States in 2009 or 2010.
- 2012: Hurricane Isaac, a Category 1 hurricane, made landfall on August 28, and on that day shut-in production totaled 1.3 million bbl/d of crude oil and 3 Bcf/d of natural gas. On top of this shut-in production, 0.9 million bbl/d of petroleum refinery capacity and 1.5 million bbl/d of petroleum pipeline capacity were temporarily shut down, in addition to more than 10 Bcf/d of shut-in natural gas processing plant capacity, according to data collected from the Form EIA-757B survey. During the following week, the shut-in capacity at these processing plants rapidly came back on line.
EIA plans to issue a supplement on the 2013 hurricane season in conjunction with the June edition of the Short-Term Energy Outlook.
Tags: disruption, Gulf Coast, liquid fuels, natural gas, offshore, oil/petroleum, weather