For appliances, choosing the most cost-effective option depends on several factors
Republished: May 29, 10:00 am: Graph was clarified.
Consumers in the market for new appliances have a wide range of choices that likely vary by cost, options, and efficiency level. If energy cost effectiveness is a factor in the decision, picking the most cost-effective model involves comparing the upfront purchase price and an estimate of the expected lifetime energy costs of different options. This calculation requires inputs for equipment lifetime, energy costs, appliance performance, and the time value of money.
Upfront capital costs are relatively simple to compare. Customers can quickly review costs, factor in rebates or incentives, and determine the most and least expensive options. But operating costs are also important. For some appliances, cumulative operating costs over time can exceed upfront costs.
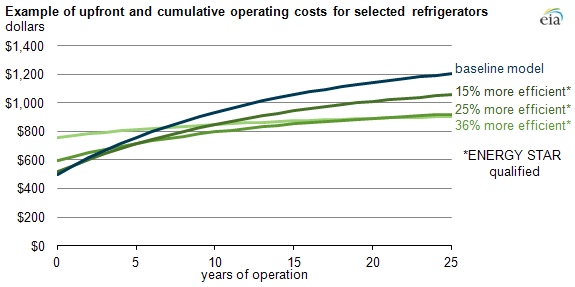
For example, the graphic above illustrates the differences in capital and energy costs of four refrigerators of the same size and type with varying efficiency over time. For the first two years, the baseline (least efficient) option has the lowest total cost of ownership. Over time, the more efficient options have lower cumulative operating costs. After two years, the first ENERGY STAR refrigerator (15% more efficient than baseline) becomes more cost effective than the baseline option. After five years, the 25% more efficient refrigerator is the most cost effective. After 19 years, the most efficient option becomes the most cost effective even though it was originally the most expensive. While 19 years may be longer than most people stay in the same house and near the end of a refrigerator's expected lifetime, EIA survey data show that about 8% of households have a refrigerator that is at least 20 years old.
The example above is intended to show how operating costs can affect the calculation of cost effectiveness for refrigerators. For appliances in general, these calculations require consideration of several factors, including:
- Expected demand for services. For some services, like refrigeration, energy demand is fairly constant across ranges of climate and consumer behavior. Other services such as heating and cooling vary based on the size of the home, the level of insulation and air-tightness, climate, and consumer behavior.
- Energy efficiency. Most major appliances are marketed with yellow EnergyGuide labels that show the efficiency rating and expected fuel costs based on expected usage and national energy prices. These labels are a relatively quick and simple way to compare the efficiencies and annual energy costs of different options.
- Regional fuel prices. The EnergyGuide labels are typically based on national average fuel costs. Because fuel costs vary over time and region of the country, consumers should factor in local differences.
- Incentives. Tax credits, utility rebates, or other incentives can lower upfront capital costs. In early 2013, several tax credits for equipment such as natural gas-fired furnaces, electric heat pumps, and central air conditioners were extended through the end of the year.
- Other costs. Some major equipment may involve costs that can vary considerably if retrofitting or installing a replacement system. For instance, a retrofit that includes a change in heating fuels may require additional costs for installing ductwork, pipelines, and other equipment. In other cases, there may be incentives to retire old equipment, as with Ohio's program for old refrigerators.
- Time horizon. Operating costs are subject to several assumptions involving time. For some households, shorter or longer time horizons may be considered based on how long owners expect to live in that house or expect to own and maintain that equipment.
- The value of money over time. The calculation illustrated in the graphic uses a 7% nominal discount rate to reflect the time value of money. Higher discount rates, which place more emphasis on current and near-term expenses, would tend to make equipment with lower up-front costs relatively more attractive.