EIA reports track U.S. crude oil production statistics and trends
With increasing crude oil prices and rig counts over the past several months, the U.S. Energy Information Administration (EIA) continues to closely monitor U.S. crude oil production trends. EIA publishes several reports that cover current crude oil production conditions and how recent trends may affect the near-term outlook for the oil industry. Each product is distinct in its purpose, methodology, timeframe, and regional coverage. While some reports are estimates of current production volumes, others focus on forecasting future production.
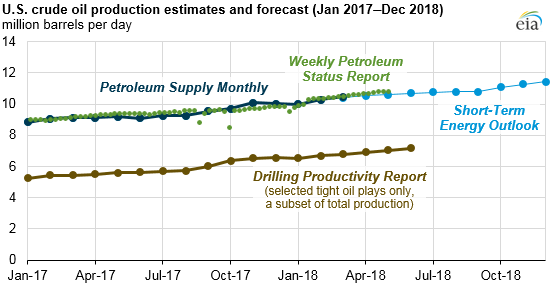
The Petroleum Supply Monthly (PSM) reports estimates of crude oil and petroleum products data, including production, imports and exports, movements, and inventories at national and regional levels, for the reporting period ending two months before the report is released. PSM estimates of crude oil production rely on data that are collected on Form EIA-914, Monthly Crude Oil and Lease Condensate, and Natural Gas Production Report and are considered the definitive estimate of crude oil production volumes by EIA and the petroleum industry.
Form EIA-914, which collects data from a statistical sample of well operators (i.e., oil and natural gas companies) in 15 states and the Federal Offshore Gulf of Mexico (GOM), represents more than 90% of crude oil production in the United States. EIA relies on data from state agencies and Form EIA-182, Domestic Crude Oil First Purchase Report, to estimate crude oil production for the remaining states that are not collected individually on Form EIA-914. According to PSM data, U.S. crude oil production averaged more than 10 million barrels per day (b/d) from November 2017 through March 2018 excluding January (the latest data available). March data was released on Thursday, May 31.
The Weekly Petroleum Status Report (WPSR) is a compilation of data that can be used to estimate the previous week’s U.S. crude oil balance and supplies of petroleum products. WPSR’s closely followed U.S. crude oil balance includes independently developed components that report estimates of U.S. crude oil production, imports, refinery runs, exports, and stock changes. WPSR estimates are based on several sources, which primarily include EIA surveys, exports data collected by U.S. Customs and Border Protection, and a derived crude oil adjustment figure that captures the cumulative statistical uncertainty associated with each of the supply and disposition components.
WPSR crude oil production estimates are based on preliminary model runs from EIA’s Short-Term Energy Outlook for Lower 48 and GOM production and on daily data for the North Slope of Alaska reported by the Trans-Alaska Pipeline. Unlike other reports or products, WPSR data are not re-estimated retroactively, because they are a snapshot in time of the best available information for a given week. Starting with WPSR data for the week ending Friday, June 1, 2018 (to be released on June 6), weekly crude oil production estimates will be rounded to the nearest 100,000 b/d.
The Drilling Productivity Report (DPR) provides a month-ahead projection of oil production for seven significant U.S. tight oil and shale gas formations. DPR analyzes these formations as geographic regions that contain all counties that have any portion of each tight oil formation as well as conventional resources. To derive a projection for each region, the DPR methodology uses recent data on the total number of drilling rigs, estimated per-rig drilling productivity, changes in production from existing oil wells, and operators’ well completion filings.
Because tight oil and conventional oil production that occurs in the DPR regions is only a subset of total U.S. crude oil production, aggregated values from the DPR will be less than those in the PSM and WPSR. Starting in August 2017, the DPR included coverage of crude oil and natural gas production in the Anadarko region and combined two other regions—the Marcellus and the Utica—into one Appalachia region.
The Short Term Energy Outlook (STEO) provides total Lower 48 onshore production forecasts based on current and projected rig counts, rig and well productivity trends, and decline rates of legacy production. Production projections are modeled at the state and DPR regional levels for benchmarking and calibration, but they are published only at the total Lower 48 onshore level. Unlike the DPR, STEO also incorporates a short-term oil price path used to project rig activity and production volumes 13 to 24 months into the future. STEO’s forecast also includes projections for the GOM and Alaska, using historical data, information about upcoming projects, and seasonal factors such as hurricane-related outages and pipeline maintenance.
These production estimates are connected in several ways. The STEO forecasts are benchmarked at the state level to the latest monthly oil production estimates from the PSM. STEO estimates are one input to the WPSR’s weekly estimate of U.S. crude oil production. In addition, the onshore portion of STEO’s forecast is calibrated with the DPR, whose seven regions currently account for more than 70% of total U.S. onshore production.
Principal contributor: Hannah Breul