Natural gas generators make up the largest share of overall U.S. generation capacity
For the next two weeks (December 18–December 29), Today in Energy will feature a selection of our favorite articles from 2017. Today’s article about natural gas power plants was originally published on April 20. Similar articles examined hydroelectric, coal, nuclear, wind, solar, petroleum, and other electricity generators.
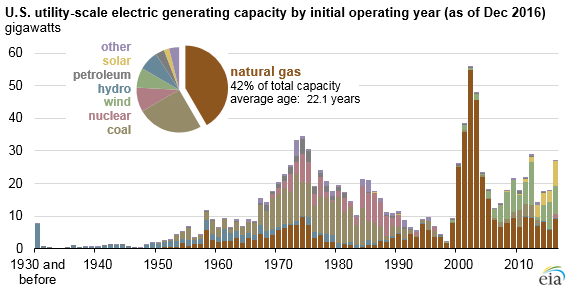
In 2016, natural gas-fired generators accounted for 42% of the operating electricity generating capacity in the United States. Natural gas provided 34% of total electricity generation in 2016, surpassing coal to become the leading generation source. The increase in natural gas generation since 2005 is primarily a result of the continued cost-competitiveness of natural gas relative to coal.
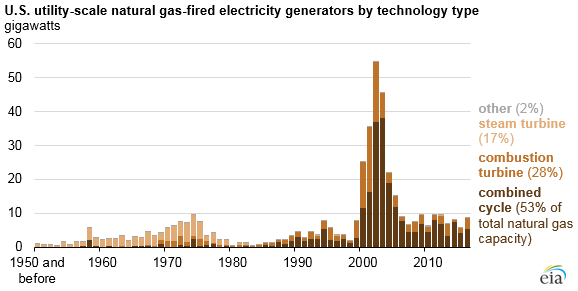
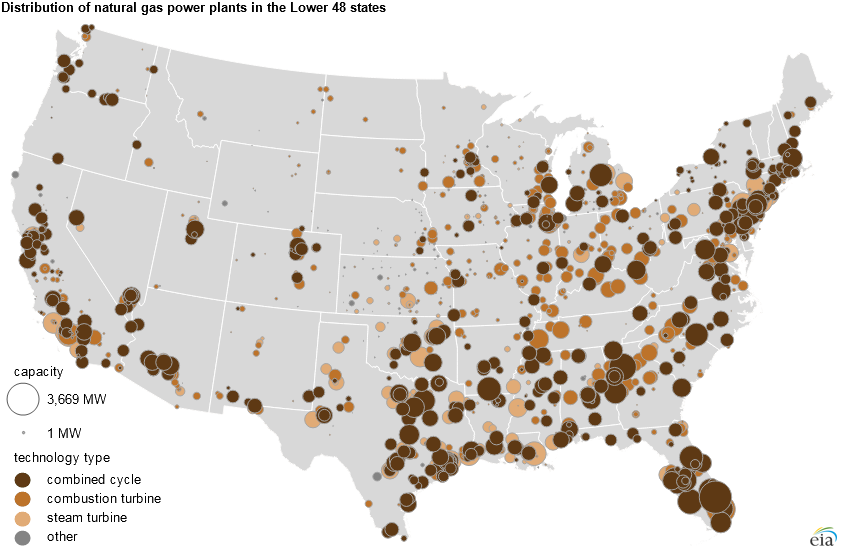
Natural gas-fired combined-cycle units accounted for 53% of the 449 gigawatts (GW) of total U.S. natural gas-powered generator capacity in 2016. Combined-cycle generators have been a popular technology choice since the 1990s and made up a large share of the capacity added between 2000 and 2005. Under current natural gas and coal market conditions in many regions of the country, combined-cycle generating units are often used as baseload generation, which operate throughout the day.
Other types of natural gas-fired technology, such as combustion turbines (about 28% of total natural gas-powered generator capacity) and steam turbines (17%), generally only run during hours when electricity demand is high. The capacity-weighted average age of U.S. natural gas power plants is 22 years, which is less than hydro (64 years), coal (39), and nuclear (36).
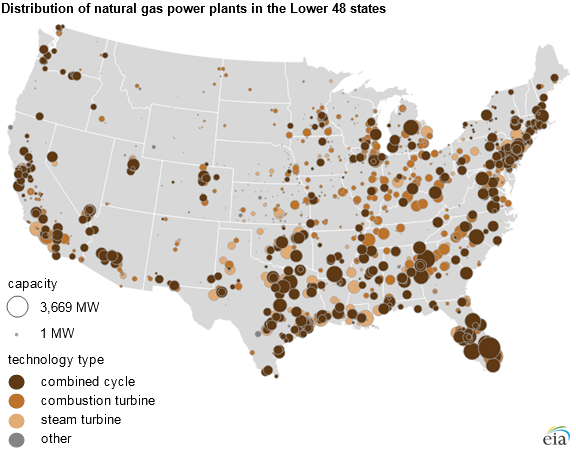
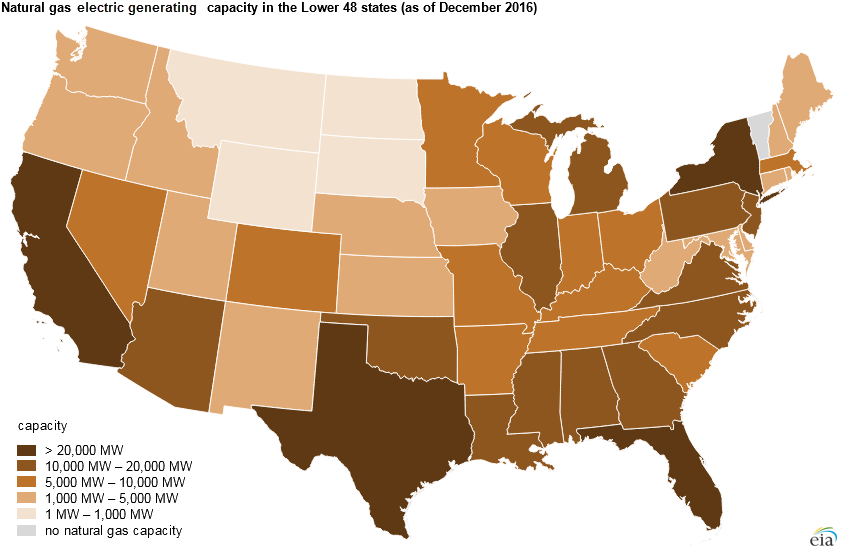
Natural gas-fired capacity is widely distributed across the United States. Every state except Vermont has at least one natural gas plant. About 38% of U.S. natural gas-fired generation capacity is located in four states: Texas, California, Florida, and New York. Natural gas power plants account for more than half of the total electricity generating capacity in each of these four states and in seven other states. Texas has the most natural gas-fired capacity of any state, with 69 GW, or 15% of the national total. California and Florida each have about 40 GW of natural gas-fired capacity.
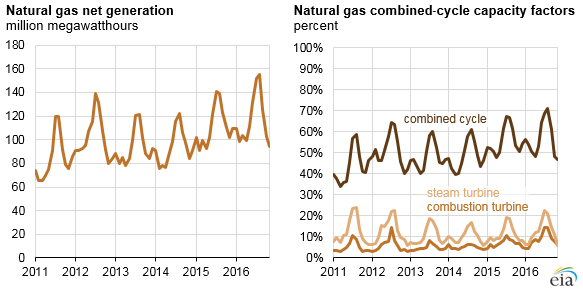
The operating profile of the nation’s natural gas-fired generation facilities varies, depending on the overall level of electricity demand, plant efficiency, and natural gas prices. The average capacity factor, a metric that measures the utilization of power plants, for natural gas combined-cycle units has increased from 43% in 2011 to 56% in 2016. The upward trends in both natural gas net generation and the natural gas-fired combined-cycle annual capacity factor (which is approaching 60%) highlight the growing contribution of natural gas-fired combined-cycle generators, which traditionally only served peaking and intermediate loads, but now have increasingly become more common to meet baseload demands.
Source: U.S. Energy Information Administration, Preliminary Monthly Electric Generator Inventory
Note: Click to enlarge.
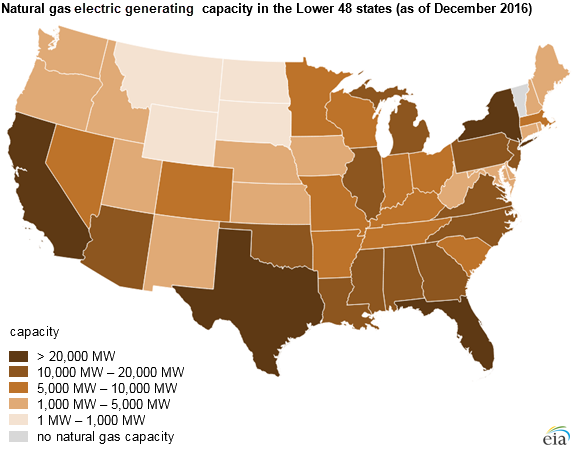
Source: U.S. Energy Information Administration, Preliminary Monthly Electric Generator Inventory
Note: Click to enlarge.
This article is part of a series of Today in Energy articles examining the fleet of utility-scale power plants in the United States. Other articles have examined hydroelectric, coal, nuclear, wind, solar, petroleum, and other generators.
Principal contributor: Augustine Kwon
Tags: capacity, electricity, generation, map, natural gas, states