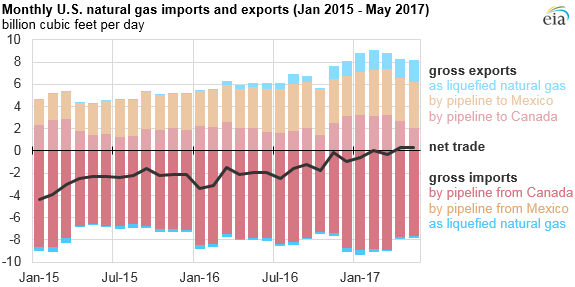
In new trend, U.S. natural gas exports exceeded imports in 3 of the first 5 months of 2017
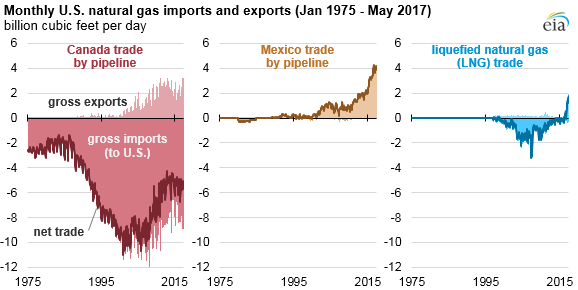
The United States exported more natural gas than it imported in February, April, and May of 2017 according to the latest EIA’s Natural Gas Monthly. The United States has been a net natural gas importer (on an average annual basis) for nearly 60 years. Declining net pipeline imports from Canada, growing natural gas pipeline exports to Mexico, and increasing exports of liquefied natural gas (LNG) are all contributing to the nation’s ongoing shift toward being a net exporter.
The United States began importing more natural gas than it exported in 1958, when total natural gas trade volumes were much smaller. In October of that year, the TransCanada pipeline was completed, allowing Western Canadian natural gas to enter northeastern U.S. markets. Net U.S. natural gas imports from Canada peaked in 2007, averaging over 10 billion cubic feet per day (Bcf/d). More recently these volumes have been declining as domestic natural gas production from shale gas and tight oil formations has increased and displaced Canadian natural gas. Border crossings in Idaho and Montana make up the largest portions of natural gas entering the United States from Canada by pipeline, making up about 25% and 20%, respectively, in 2016.
While the United States remains a net importer of natural gas from Canada, U.S. exports to eastern Canada have been increasing steadily since 2000, when the Vector pipeline began service. The Vector pipeline, with a capacity of 1.3 Bcf/d, originates in Chicago and is currently supplied by natural gas from western Canada, Texas, Louisiana, and Oklahoma. It delivers natural gas at the border in St. Clair, Michigan, and into Ontario’s Dawn hub. U.S. natural gas exports from Michigan, mainly through the Vector pipeline, make up most of the natural gas export volumes by pipeline to Canada.
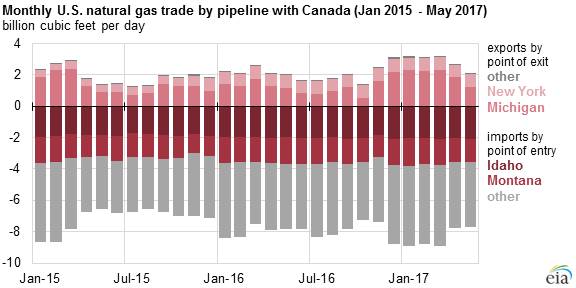
Since 2011, several pipeline reversals have contributed to the growing volume of natural gas delivered into Canada from both the Midwest and Northeast. In March 2017, total U.S. natural gas exports to Canada were 3.21 Bcf/d, near the monthly record of 3.25 Bcf/d reached in December 2012; U.S. exports declined in both April and May.
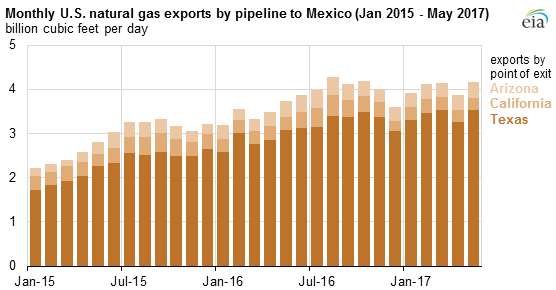
Natural gas exports to Mexico from the United States also reached near-record levels in the first five months of 2017, averaging 4.04 Bcf/d. Since 2010, when U.S. natural gas exports by pipeline to Mexico averaged 0.91 Bcf/d, these volumes have been steadily increasing, reaching an annual average of 3.78 Bcf/d in 2016. This growth in trade with Mexico has been the result of several factors, including growth in U.S. natural gas production, declines in domestic natural gas production in Mexico, increased use of natural gas in Mexico for industrial use and in electric power generation, and the ongoing expansion of the natural gas pipeline network at the United States-Mexico border and within Mexico.
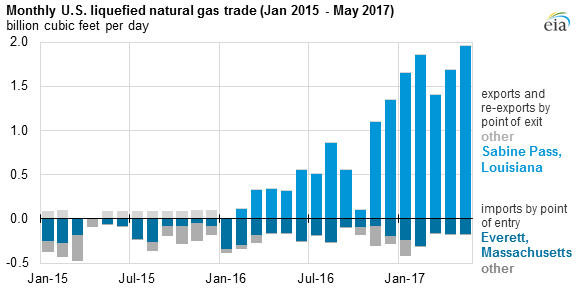
The transition of the United States from a net importer of natural gas to a net exporter is also marked by the emergence of liquefied natural gas (LNG) exports from Sabine Pass, Louisiana, which set a new record of 1.96 Bcf/d in May 2017. Since U.S. LNG exports from the Lower 48 states began in February 2016, Sabine Pass has commissioned three liquefaction trains, with the fourth train coming online in the next few months. The United States still imports LNG from overseas, primarily at Everett, Massachusetts, but these volumes averaged only 0.20 Bcf/d over the first 5 months of 2017.
Principal contributors: Katie Dyl, Victoria Zaretskaya