New EIA data series track shipments of hydrocarbon gas liquids by rail
Note: Includes shipments within the United States and trade with Canada.
Republished February 2, 2017, 4:30 p.m. to correct the units on the graph.
Adding to its data series of rail movements of crude oil, ethanol, and biodiesel, EIA recently released data on rail movements of propane, propylene, normal butane, and isobutane. These four petroleum products make up the majority of hydrocarbon gas liquids (HGLs) moved by rail. The new series are integrated with EIA's existing Petroleum Supply Monthly statistics, which already include movements of crude oil and select products by pipeline, tanker, and barge.
The new HGL-by-rail series includes shipments between and within Petroleum Administration for Defense Districts (PADDs) as well as shipments to and from Canada. The new data improve EIA’s petroleum statistics by providing more accurate product supplied information for each region.
EIA published the series with monthly data from January 2010 through November 2016, the current reporting month. EIA developed the new series using information provided by the U.S. Surface Transportation Board (STB).
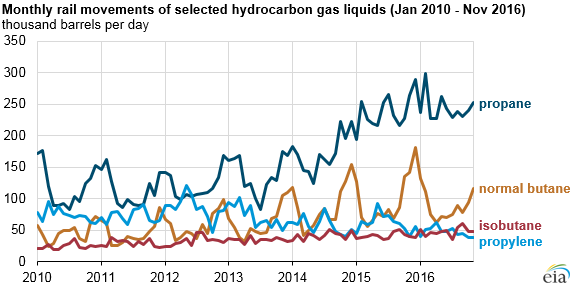
Pipelines are the primary mode of transport for crude oil and petroleum products, including HGLs. Rail shipments of propane, propylene, normal butane, and isobutane account for nearly a quarter of all inter-PADD movements of these HGLs. EIA’s new data will complement existing data on the shipment of HGLs by pipeline and by tanker and barge. Rail movements of these products averaged 426,000 barrels per day (b/d) in 2016 (Jan–Nov). By comparison, rail movements of ethanol and crude oil averaged 637,000 b/d and 478,000 b/d, respectively, during the same period.
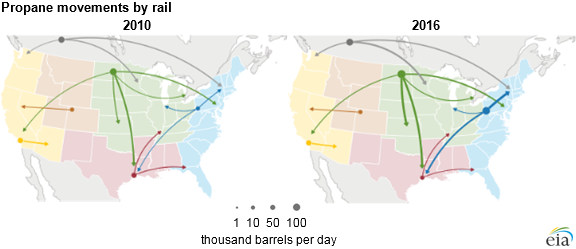
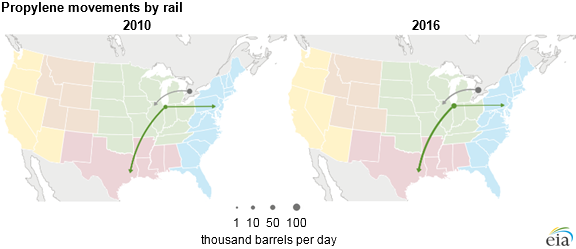
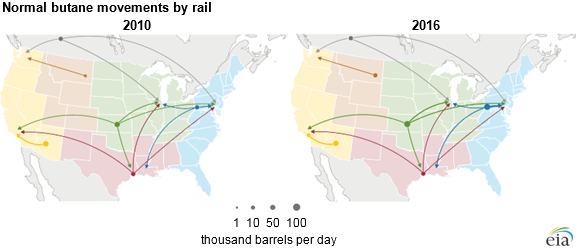
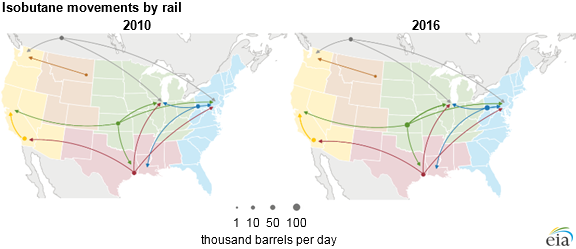
The maps below provide general flows of each of the four HGL products in 2010 and the first 11 months of 2016.
Source: U.S. Energy Information Administration, Petroleum Supply Monthly
Propane volumes moved by rail are the largest among the four HGL products and increased from 106,000 b/d in 2010 to 244,000 in 2016 (Jan–Nov) as domestic propane production has increased. While most propane is shipped by pipeline, rail movements are more common than other HGL-by-rail shipments and are often higher during winter months when propane is used as a heating fuel.
Source: U.S. Energy Information Administration, Petroleum Supply Monthly
Outside the Gulf Coast (PADD 3), where pipelines are available to transport propylene, all propylene movements are by rail. For this reason, EIA’s data on propylene-by-rail movements will be the first series showing inter-PADD propylene shipments and receipts. Propylene, which is used in the production of plastics and resins, moves primarily from the Midwest (PADD 2), where most propylene is produced at refineries, to petrochemical producers in PADD 3. Propylene is also imported from Canada, but propylene imports from Canada have declined as Canada’s petrochemical industry has switched from using Canadian propane to U.S. ethane as a feedstock.
Source: U.S. Energy Information Administration, Petroleum Supply Monthly
Normal butane is the second-largest HGL-by-rail product by volume. Like propane, normal butane is a highly seasonal commodity, and the majority of shipments are by pipeline. Demand for normal butane is typically higher during the winter, when several states set higher gasoline specifications for Reid vapor pressure, which allow blenders to mix normal butane into motor gasoline. Consumption of normal butane has increased in recent years as gasoline demand has risen. In addition, rail shipments of normal butane have increased as production of normal butane has increased in some areas with insufficient pipeline infrastructure. Normal butane shipments within and out of the East Coast (PADD 1 nearly quadrupled from 2010 to 2016 (Jan–Nov), and movements within and out of the Midwest (PADD 2) more than doubled.
Source: U.S. Energy Information Administration, Petroleum Supply Monthly
Isobutane, along with propylene or butylenes, is used in refinery alkylation units, and the resulting product is blended into gasoline. Similar to trends in shipments of propane and normal butane, shipments of isobutane by rail have increased primarily because recent growth in isobutane production has occurred in regions with insufficient pipeline capacity. Recent demand for high-octane gasoline additives has further increased demand for isobutane, leading to more shipments by rail.
Register for today’s (February 2) EIA webinar on HGL movements by rail to be held at 11:00 Eastern Time.
Principal contributors: Arup Mallik, Warren Wilczewski