Global upstream oil and gas spending continues to favor exploration and development
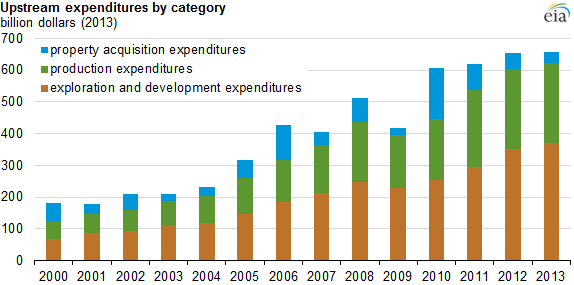
Annual reports from 42 oil and natural gas companies that have reported data on upstream expenditures since 2000 show that spending on exploration and development throughout the world increased by 5% ($18 billion) in 2013, while spending on property acquisition fell by $17 billion. Total upstream spending by these companies was relatively flat in 2013 (plus 0.4%) after a period of strong growth (averaging 11% per year) from 2000 to 2012.
The reports, which are filed with the U.S. Securities and Exchange Commission, show that the slight increase in spending in 2013 was driven by expenditures to explore and develop fields acquired in earlier years.
In the past two years, flat oil prices and rising costs have contributed to declining cash flow for this group of companies. Continued declines in cash flow, particularly in the face of rising debt levels, could challenge future exploration and development. However, reduced spending levels could be offset by rising drilling and production efficiency.
Upstream expenditures for oil and natural gas production activities are reported in three categories: property acquisition, exploration and development, and production. Exploration and development includes expenditures related to searching for and developing the facilities and infrastructure to produce reserves. Production includes costs associated with extracting oil and natural gas from the ground once the field has been developed. Property acquisition includes costs incurred to purchase proved and unproved oil and natural gas reserves.
Acquisition expenditures can fluctuate, spiking when there are large mergers and acquisitions. After a large increase in 2010, driven by ExxonMobil's acquisition of XTO, an independent oil and gas producer, acquisition expenditures have declined steadily and in 2013 were the lowest since 2009.
This analysis encompasses 42 U.S. and international oil and gas companies that have reported data on upstream expenditures since 2000. The companies range in size of production and include both large producers such as ExxonMobil and Brazil's Petrobras, and smaller ones such as Encana Corporation and Talisman Energy. The 42 companies accounted for approximately 39% of non-OPEC production in 2013, and they had a combined market capitalization of more than $2.4 trillion.
Principal contributor: Jeff Barron