Released: April 16, 2014
Next Release: April 23, 2014
Upstream oil and gas spending continues to favor exploration and development activity
Annual reports by oil and natural gas companies show that spending on exploration and development activities increased by 5% ($18 billion) in 2013, while spending on property acquisition continued to decline by $17 billion. Total upstream spending was relatively flat after a period of strong growth (averaging 11% per year) from 2000 to 2012.
In the past two years, flat oil prices and rising costs have contributed to declining cash flow for this group of companies. Continued declines in cash flow, particularly in the face of rising debt levels, could challenge future exploration and development. However, reduced spending levels could be offset by rising drilling and production efficiency.
EIA reviewed data from 42 recently released financial statements for public oil and natural gas companies. The reports, required by the U.S. Securities and Exchange Commission, show that the slight increase in spending was driven by expenditures to develop fields acquired in previous years. Expenditures to buy new property fell in 2013, and spending on production activities was flat.
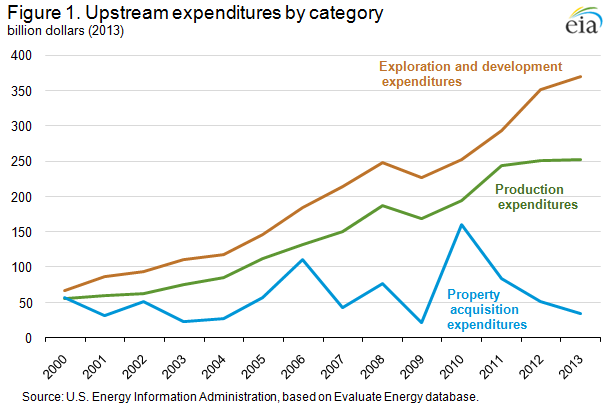
Companies report expenditures related to oil and natural gas production activities in three categories: property acquisition, exploration and development, and production, collectively referred to as the upstream. Property acquisition includes costs incurred to purchase proved and unproved reserves. Exploration and development includes expenditures related to searching for and developing the facilities and infrastructure to produce reserves. Production includes costs associated with extracting oil and natural gas from the ground once the field has been developed.
Composition of the 0.4% increase in upstream spending in 2013 included the following: exploration and development expenditures rose 5% ($18 billion) in 2013 (Figure 1), while production expenditures grew by just 0.6% ($1.4 billion) and acquisition expenditures decreased 33% ($17 billion). Acquisition expenditures can fluctuate, spiking when there are large mergers and acquisitions. After a large increase in 2010, driven by ExxonMobil's acquisition of XTO, an independent oil and gas producer, acquisition expenditures have declined steadily and in 2013 were the lowest since 2009.
For this analysis, EIA considered 42 U.S. and international oil and gas companies that have reported data on upstream expenditures since 2000. The companies range in size of production and include publicly traded as well as state-owned enterprises, including large producers such as ExxonMobil and Petrobras, and smaller ones such as Encana Corporation and Talisman Energy. The 42 companies made up approximately 39% of non-OPEC production in 2013, and had a combined market capitalization of more than $2.4 trillion.
Generally rising oil prices from 2000 through 2011 contributed to large increases in the companies' cash flow from operations (Figure 2) and provided the funds needed to increase upstream expenditures. As crude oil prices increased, projects that had been uneconomic became feasible. Companies significantly expanded operations related to tight oil production in the United States and oil sands production in Canada. With many companies expanding oil and gas production activities at the same time, costs for equipment and personnel also increased, further pushing up expenditures. Costs for raw materials increased as most commodities experienced a general price rise from 2002 through 2008, although commodity prices have come down since 2012. After the 2008-09 economic downturn, property acquisition expenditures slowed first, as spending shifted to exploration, development, and production.
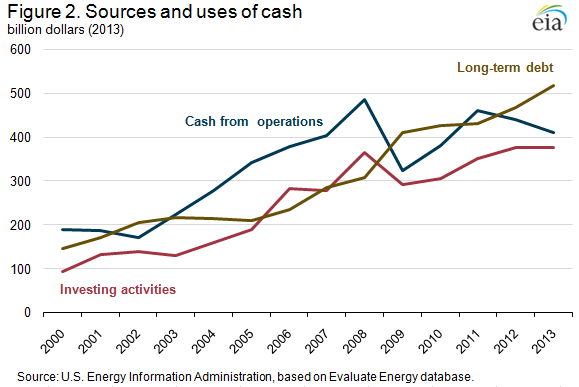
Although oil prices remained relatively flat in 2012 and 2013, rising costs contributed to a decline in cash flow from operations. Nonetheless, cash spent on investing activities, which tends to lag changes in cash flow, increased slightly in 2013 as companies increased debt to maintain investment, taking advantage of interest rates that have been low since 2009. Companies have increased debt every year since 2006, with long-term debt increasing 9% and 11% in 2012 and 2013, respectively.
With a larger share of cash flow from operations directed to investing activities, companies have made less money available for financing activities, including dividends paid to shareholders, share repurchases, and changes in debt. Dividends increased 1% in 2013, but the dollar amount was more than twice as high as the amount paid in 2000. Repurchase of outstanding shares decreased for the second year in a row in 2013 and was well below the 2006 peak, but remained a substantial use of cash.
April Drilling Productivity Report indicates continuing oil production growth
The April update to the Drilling Productivity Report (DPR) indicates continuing oil production growth in the key oil-producing regions. Altogether, in the Bakken, Niobrara, Permian, and Eagle Ford, oil production is expected to increase by 70,000 bbl/d in May 2014. The monthly growth rate is 3,000 bbl/d more than in April 2014 due to solid gains in Permian rig count and continuous rig productivity gains across the regions. While the DPR does not forecast weather impact, the spring thaw season has officially started in the Bakken region and may disrupt some drilling activity between now and June.
Gasoline prices mostly up, diesel fuel prices down slightly
The U.S. average price for regular gasoline increased by six cents this week to $3.65 per gallon as of April 14, 2014, 11 cents higher than the same time last year. West Coast and Gulf Coast prices increased by 10 cents and 8 cents, to $3.98 and $3.47 per gallon respectively. The Midwest gasoline price rose by six cents to $3.63 per gallon, while the average gasoline price on the East Coast increased three cents to $3.61 per gallon. The Rocky Mountains saw the only price decline, by a penny to $3.44 per gallon.
The U.S. average price for diesel fuel fell by a penny this week to $3.95 per gallon, a cent higher than at the same time last year. East Coast, Rocky Mountain, and Midwest diesel fuel prices all decreased by a cent, to $4.07, $3.94 and $3.93 per gallon respectively. West Coast and Gulf Coast prices each fell by less than a penny, remaining at $3.98 and $3.79 per gallon respectively.
Propane inventories gain
U.S. propane stocks increased by 0.8 million barrels last week to 28.4 million barrels as of April 11, 2014, 10.7 million barrels (27.3%) lower than a year ago. Inventories in the Midwest, East Coast, and Rocky Mountain/West Coast increased by 0.7 million barrels, 0.3 million barrels, and 0.1 million barrels, respectively, while Gulf Coast inventories decreased by 0.3 million barrels. Propylene non-fuel-use inventories represented 11.1% of total propane inventories.
Text from the previous editions of This Week In Petroleum is accessible through a link at the top right-hand corner of this page.
 |
 |
||||||
| Retail Data | Change From Last | Retail Data | Change From Last | ||||
| 04/14/14 | Week | Year | 04/14/14 | Week | Year | ||
| Gasoline | 3.651 | Diesel Fuel | 3.952 | ||||
 |
 |
||||||||||||||||||||||||||
|
 |
||||||||||||||||||||||||||
| *Note: Crude Oil Price in Dollars per Barrel. | |||||||||||||||||||||||||||
 |
 |
||||||
 |
 |
||||||
| Stocks Data | Change From Last | Stocks Data | Change From Last | ||||
| 04/11/14 | Week | Year | 04/11/14 | Week | Year | ||
| Crude Oil | 394.1 | Distillate | 111.9 | ||||
| Gasoline | 210.3 | Propane | 28.357 | ||||