Annual Energy Outlook 2022: Alternative Policies for Carbon Fee Cases
The Annual Energy Outlook 2022: Alternative Policies for Carbon Fee Cases is based on the Annual Energy Outlook 2022 which reflects current laws and regulations as of November 2021. As such, it does not incorporate the recently enacted Inflation Reduction Act, which will be reflected in future editions of the AEO.

Executive Summary
This Issues in Focus article presents a series of cases that apply carbon fees on energy-related carbon dioxide (CO2) emissions. We examine how economy-wide carbon fees influence total, sectoral, and fuel-specific energy-related CO2 emissions, as well as fuel prices. We also examine how the effect of carbon fees varies under different assumptions about macroeconomic growth. Applying carbon fees to the National Energy Modeling System (NEMS), the model underlying this analysis, is a practical way to highlight cost-effective, low-carbon technology pathways across the energy system, which can inform future policy discussions.
We released our Annual Energy Outlook 2022 (AEO2022) in March. In the AEO2022 Reference case, we generally assume that existing laws and regulations remain as enacted through 2050 (the projection period), including the timing for when the laws or policies are scheduled to end (or sunset). The AEO2022 Reference case provides a baseline to compare the effects of the various carbon fees we considered. Unless otherwise specified, the cases in this article start with the AEO2022 Reference case and change particular assumptions to address uncertainty about the future of selected existing laws and regulations.
The analysis in this report focuses on the impacts of an economy-wide carbon fee on energy-related CO2 emissions. We do not assess the full costs and benefits considered in discussions about such a carbon fee policy. For example, this report does not quantify the full economic or social costs associated with a carbon fee policy, nor does it evaluate the societal benefits of reducing CO2 emissions, such as those suggested by the social cost of carbon. In addition, we are expanding our ability to model deep decarbonization pathways in NEMS. Specifically, we are improving our representation of:
- Sources, refining, transportation, and usage of biofuels
- Bulk production and supply of hydrogen
- Increased use of electric power and net decarbonization of the electric power sector
- Direct air capture
- End uses of captured CO2
This analysis does not account for these pathways, but rather, it focuses on the relative changes across carbon fee scenarios.
We find that charging a fee on fossil fuels proportional to their carbon content leads to significant differences in projected energy prices, fuel consumption, carbon capture and sequestration, carbon intensity, and overall energy-related CO2 emissions. Our projections of total energy-related CO2 emissions are lower when a carbon fee is applied to fossil fuels, and higher fees result in larger reductions in CO2 emissions. Most emission reductions from carbon fees come from the electric power sector. Significantly smaller shares of emission reductions come from transportation and other economic sectors.
Carbon fee cases
The carbon fee cases assume economy-wide implementation of $15.00, $25.00, and $35.00 (2021 dollars per metric ton [mt] of CO2) carbon fees starting in 2023, based on the AEO2022 Reference case. We also apply a $35.00 fee based on the AEO2022 Low Economic Growth and High Economic Growth cases. These fees increase by 5% (in real dollars) per year and reach $56.00 (2021 dollars per mt of CO2) in the $15 Fee case, $93.34 in the $25 Fee case, and $130.67 in the $35 Fee case by 2050. CO2 emissions revenues are distributed back to consumers in lump-sum payments, keeping the government deficit neutral. The fee cases do not pertain to any specific law or regulation, but rather they represent generic, economy-wide carbon prices. Introducing economy-wide carbon fees provides a convenient modeling mechanism to highlight cost-effective, low-carbon technology pathways that can inform future policy discussions.
In the three carbon fee cases based on the AEO2022 Reference case, total energy-related CO2 emissions decline early in the projection period before leveling off in the late 2030s. We project that U.S. energy-related CO2 emissions in the $35 Fee case fall 23% below 2021 levels (38% below 2005 levels) by 2050 and 22% below the AEO2022 Reference case 2050 level.
The AEO2022 Low Economic Growth and High Economic Growth cases explore the uncertainty around economic growth rates by changing assumptions about population, productivity, employment, and GDP. Applying a carbon fee to the Low Economic Growth case reduces projected CO2 emissions, both as a result of higher prices for fossil fuels and of decreased consumption related to slower economic growth.
Results vary when applying a carbon fee to the High Economic Growth case. The carbon fee reduces CO2 emissions because the additional cost decreases demand for fossil fuels and provides incentive for fuel switching; however, strong economic growth increases CO2 emissions by increasing energy demand. The net impact of these combined effects can differ across fuels and economic sectors and depends on the sensitivity of consumers and producers in each sector to price changes.
Sector impacts
Electric power
The electric power sector is the most responsive to carbon fees because the fees provide an incentive to develop renewable generation. As a result, we project that coal loses more market share in electric generation than in our Reference case, and coal consumption greatly decreases between 2021 and 2025 in all carbon fee cases.
Residential and commercial
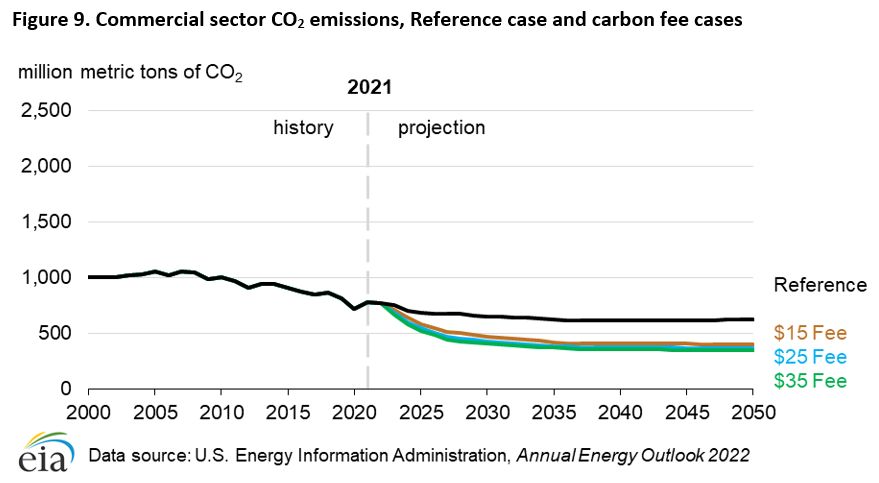
We expect changes in electric power sector CO2 emissions will affect the CO2 emission levels of the consuming sectors. Because electricity is a main source of energy for the residential and commercial sectors, changes in the carbon intensity of electricity significantly affect the CO2 emissions from these sectors. The $35 Fee case results in a 56% decline in energy-related CO2 in the residential sector during the projection period, mostly due to the lower carbon intensity of electricity. The U.S. commercial sector uses electricity for much of its energy, especially for space cooling and refrigeration. As a result, nearly all of its 56% decline in CO2 emissions by 2050 in the $35 Fee case is associated with reduced CO2 emissions in the electric power sector.
Industrial
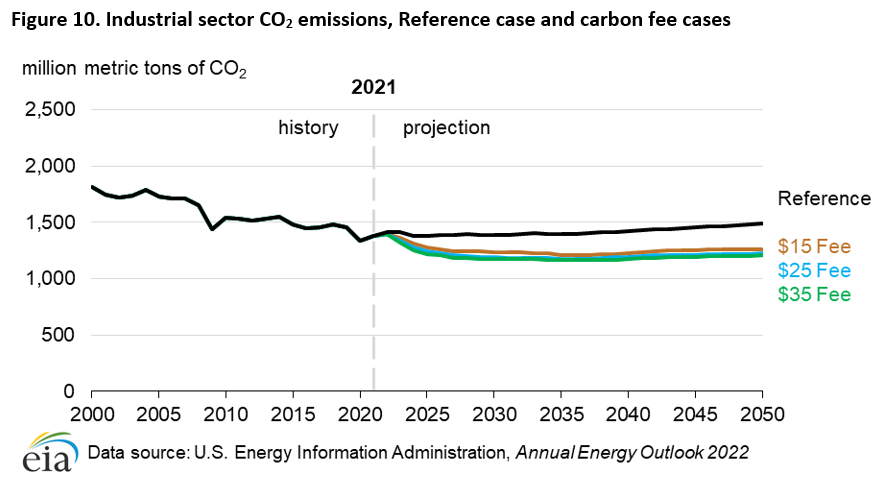
Energy-related CO2 emissions from the industrial sector decrease 14% from 2021 to 2050 in the $35 Fee case, compared with a 6% increase over the same period in the AEO2022 Reference case. CO2 emissions fall 19% below the Reference case in 2050 in the $35 Fee case.
Transportation
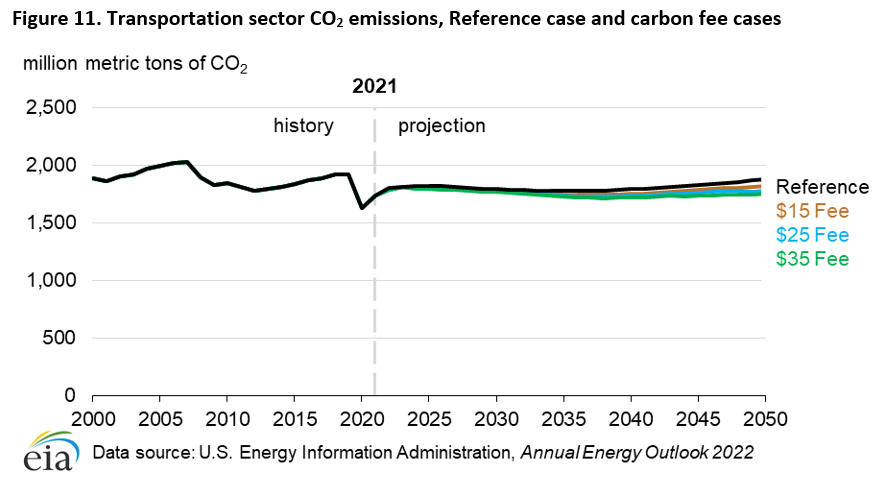
Compared with other sectors of the economy, consumers in the transportation sector don’t respond as much to changes in fuel prices because their commutes typically stay the same and they can’t easily change their fuel or transportation options. Therefore, CO2 emissions are relatively insensitive to carbon fees of the levels assumed in this analysis. By 2050, transportation sector CO2 emissions in the $35 Fee case are 7%, or 129 million metric tons (MMmt), lower than in the Reference case (Figure 11).
Caveats
When examining the results of this analysis, readers should keep several caveats in mind:
- Carbon fees are applied to each product based on its respective CO2 emissions factors, and we assume complete combustion.
- Carbon fees are applied only to fossil fuel combustion; process CO2 emissions (for example, from natural gas processing) are not captured by the fee or included in total CO2 emissions.
- Carbon fees are applied only to CO2 emissions; emissions of other greenhouse gases (for example, methane) are not captured by the carbon fee or included in total emissions.
- Revenue generated by the carbon fee is redistributed to consumers in lump-sum payments to maintain policy and revenue neutrality.
- Carbon fees are restricted to the United States; we do not consider the international implications of these fees.
- Some technology pathways in the underlying model (including hydrogen, electrification, and biofuels), as well as carbon capture, transport, utilization, and sequestration, are expanding under the Bipartisan Infrastructure Law. The projected reductions in CO2 emissions in this analysis are limited because they do not include other associated policy initiatives that could also reduce CO2 emissions.
Carbon Fees
Carbon fees are a policy mechanism intended to lessen the energy sector’s contribution toward anthropogenic climate change. In this analysis, we applied three levels of carbon fees, which gradually increase over the projection period, to the AEO2022 Reference case. In addition, we applied our highest assumed carbon fee to the AEO2022 High and Low Economic Growth cases. These fees apply to CO2 from energy combustion throughout the U.S. economy. They do not apply to other gases, such as methane, or other sources of CO2, such as from natural gas processing.
This analysis does not quantify the climate benefits of CO2 emissions reductions. For reference, current and expected climate impacts in the United States are discussed in the 2018 National Climate Assessment.1 Reductions in CO2 emissions shown in this report can be compared with the U.S. National Determined Contribution,2 as of July 2022. The U.S. National Determined Contribution documents the U.S. plan to meet its commitment under Article 4 of the Paris Agreement, which establishes that the global average temperature change should remain well below 2°C and a commitment to limit temperature change to 1.5°C.
Key findings
In each of the carbon fee cases based on the AEO2022 Reference case, U.S. energy-related CO2 emissions decline early in the projection period before leveling off in the late 2030s. The U.S. electric power sector is the most responsive sector to carbon fees. In this sector, coal loses market share to natural gas and to zero-carbon generation sources faster than in the AEO2022 Reference case. In the $35 Fee case, we project total U.S. energy-related CO2 emissions to be 22%, or 1,022 MMmt, lower than in the AEO2022 Reference case in 2050. The electric power sector accounts for 78%, or 797 MMmt, of these reductions. Our projection of 2050 U.S. energy-related CO2 emissions in the $35 Fee case are 23% lower than in 2021 and 38% lower than in 2005.
The electric power sector is also the most responsive to the $35 carbon fee in our High Economic Growth and Low Economic Growth cases. These cases reflect uncertainty around economic growth rates by changing assumptions on population, productivity, employment, and GDP. Adding a $35 carbon fee to the High Economic Growth case decreases energy-related CO2 emissions by 22%, or 1,161 MMmt, relative to our High Economic Growth case without a carbon fee. Similarly, we observe a 22% decrease, or 978 MMmt, in the Low Economic Growth case with a $35 carbon fee relative to the Low Economic Growth case without a carbon fee. Energy-related CO2 emissions decline throughout the projection period in the Low Economic Growth case with a carbon fee. In the High Economic Growth case with a carbon fee, CO2 emissions decrease early in the projection period before later increasing from 2035 to 2050. The electric power sector accounts for 76% of these CO2 emissions reductions for the High Economic Growth case and 77% of the CO2 emissions reductions in the Low Economic Growth case.
Methodology
The carbon fee cases assume economy-wide implementation of a $15.00, $25.00, and $35.00 carbon fee (2021 dollars per mt of CO2) starting in 2023. These fees increase by 5% in real dollars each year thereafter and reach $56.00, $93.34, and $130.67 per mt of CO2, respectively, by 2050 (Table 2). CO2 emissions fee revenues are distributed back to consumers through lump-sum payments, keeping the policy revenue neutral. Incorporating CO2 fees increases fuel costs based on the carbon intensity of the energy source. It also reduces consumer disposable income available for non-energy purchases.
The AEO2022 Reference case includes a 2020 COVID-19-related drop and return in energy demand and related CO2 emissions in 2021. We project that CO2 emissions in 2022 (the last year before the fee is implemented) will be 1%, or 4,884 MMmt, above 2021 levels and 7% above 2020 levels. Although CO2 emissions increased in 2021 and will likely increase in 2022, they remain about 5% below 2019 levels. U.S. total energy-related CO2 emissions peaked in 2007 at 6,016 MMmt.
Results
The National Energy Modeling System (NEMS) produces a wide range of detailed energy system projections using 10 interconnected modules, and we use these projections to develop our AEO. For this analysis, we focus on national CO2 emissions across three carbon fee cases and three baseline cases (Reference case, High Economic Growth case, and Low Economic Growth case). We will consider case results relative to the AEO2022 Reference case first, followed by results from the economic growth cases.
Total CO2 emissions
In the three cases where we add carbon fees to the AEO2022 Reference case, U.S. energy-related CO2 emissions decline before leveling off in the last 10 to 15 years of the projection period (Figure 1 and Table 2), despite increasing fees. This pattern emerges because many actions that reduce CO2 emissions, such as replacing coal-fired generation in the electric power sector with lower-CO2-emitting natural gas or non-emitting renewables, occur at the beginning of the projection period. The most cost-effective actions are rapidly implemented in NEMS (despite the carbon fees being comparatively low), which also contributes to this pattern. Other reduction strategies that may be more expensive, such as reducing CO2 from bulk chemical production and increasing penetration of alternative-fuel vehicles, require fees that are generally higher than achieved in this analysis, given Reference case technology cost and performance assumptions.
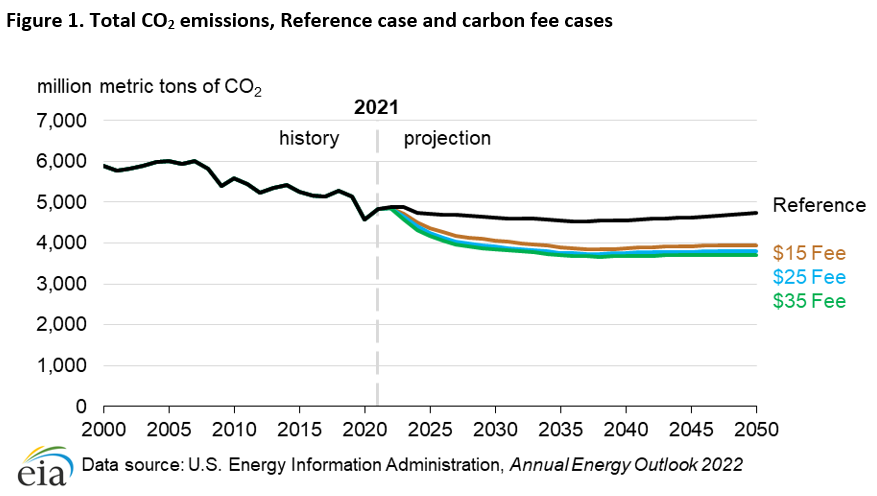
Table 1. Economy-wide CO2 emissions fees and their effects on selected energy product prices, AEO2022 carbon fee cases relative to the AEO2022 Reference case
| Carbon Fee case (2021 dollars per metric ton of carbon dioxide) | Carbon fee in 2023 (dollars per physical unit of fuel) | Carbon fee in 2050 (dollars per physical unit of fuel) |
|---|---|---|
| $15 Fee case | ||
| Gasoline (dollars per gallon) | $0.13 | $0.48 |
| Diesel (dollars per gallon) | $0.15 | $0.56 |
| Natural gas (dollars per thousand cubic feet) | $0.83 | $3.09 |
| Coal (dollars per short ton) | $27.34 | $103.03 |
| $25 Fee case | ||
| Gasoline (dollars per gallon) | $0.21 | $0.80 |
| Diesel (dollars per gallon) | $0.25 | $0.94 |
| Natural gas (dollars per thousand cubic feet) | $1.38 | $5.15 |
| Coal (dollars per short ton) | $45.57 | $171.74 |
| $35 Fee case | ||
| Gasoline (dollars per gallon) | $0.30 | $1.12 |
| Diesel (dollars per gallon) | $0.35 | $1.31 |
| Natural gas (dollars per thousand cubic feet) | $1.93 | $7.21 |
| Coal (dollars per short ton) | $63.80 | $240.42 |
| Data source: U.S. Energy Information Administration, Annual Energy Outlook 2022 | ||
The values shown in Table 1 only reflect the direct effect of an economy-wide carbon fee on energy prices.
Table 2. Carbon fees, annual energy-related CO2 emissions, and changes in CO2 emissions from previous five years, Reference case and carbon fee cases
| Cases | 2020 | 2025 | 2030 | 2035 | 2040 | 2045 | 2050 |
|---|---|---|---|---|---|---|---|
| Reference case | |||||||
| Fee in 2021$ per metric ton of CO2 | $0.00 | $0.00 | $0.00 | $0.00 | $0.00 | $0.00 | $0.00 |
| Fee in nominal dollars per metric ton of CO2 | $0.00 | $0.00 | $0.00 | $0.00 | $0.00 | $0.00 | $0.00 |
| Annual CO2 emissions (million metric tons) | 4,575 | 4,709 | 4,622 | 4,545 | 4,561 | 4,631 | 4,738 |
| Five-year change in CO2 emissions (million metric tons) | 134 | -87 | -76 | 15 | 71 | 106 | |
| $15 Fee case | |||||||
| Fee in 2021$ per metric ton of CO2 | $0.00 | $16.54 | $21.11 | $26.94 | $34.38 | $43.88 | $56.00 |
| Fee in nominal dollars per metric ton of CO2 | $0.00 | $18.10 | $26.04 | $37.21 | $53.02 | $75.93 | $109.81 |
| Annual CO2 emissions (million metric tons) | 4,575 | 4,367 | 4,064 | 3,888 | 3,871 | 3,925 | 3,947 |
| Five-year change in CO2 emissions (million metric tons) | -209 | -303 | -175 | -17 | 54 | 22 | |
| $25 Fee case | |||||||
| Fee in 2021$ per metric ton of CO2 | $0.00 | $27.56 | $35.18 | $44.90 | $57.30 | $73.13 | $93.34 |
| Fee in nominal dollars per metric ton of CO2 | $0.00 | $30.24 | $43.41 | $62.05 | $88.51 | $126.85 | $183.56 |
| Annual CO2 emissions (million metric tons) | 4,575 | 4,237 | 3,918 | 3,763 | 3,761 | 3,785 | 3,797 |
| Five-year change in CO2 emissions (million metric tons) | -338 | -320 | -154 | -3 | 24 | 13 | |
| $35 Fee case | |||||||
| Fee in 2021$ per metric ton of CO2 | $0.00 | $38.59 | $49.25 | $62.86 | $80.22 | $102.38 | $130.67 |
| Fee in nominal dollars per metric ton of CO2 | $0.00 | $42.42 | $60.80 | $86.98 | $124.26 | $178.30 | $258.16 |
| Annual CO2 emissions (million metric tons) | 4,575 | 4,168 | 3,848 | 3,710 | 3,679 | 3,696 | 3,716 |
| Five-year change in CO2 emissions (million metric tons) | -407 | -320 | -138 | -31 | 17 | 20 | |
| Data source: U.S. Energy Information Administration, Annual Energy Outlook 2022 | |||||||
Fossil fuel consumption
Carbon fees affect consumption of fossil fuels and non-carbon-emitting fuels differently. The factors that influence the response to carbon fees in our projection include:
- The carbon intensity of the fuel—measured in this report as kilograms (kg) of CO2 per million British thermal units (MMBtu)
- Changes in fuel consumption based on changes in the fuel’s price
- The availability of substitute energy sources
Table 3. Annual fossil fuel-related carbon fees, CO2 emissions, and changes in CO2 emissions from previous five years, carbon fee cases
| Cases | 2020 | 2025 | 2030 | 2035 | 2040 | 2045 | 2050 |
|---|---|---|---|---|---|---|---|
| $15 Fee case | |||||||
| Fee in 2021$ per metric ton of CO2 | $0.00 | $16.54 | $21.11 | $26.94 | $34.38 | $43.88 | $56.00 |
| Fee in nominal dollars per metric ton of CO2 | $0.00 | $18.10 | $26.04 | $37.21 | $53.02 | $75.93 | $109.81 |
| Annual CO2 emissions (million metric tons) | |||||||
| Coal | 875 | 435 | 206 | 137 | 112 | 107 | 101 |
| Petroleum | 2,042 | 2,224 | 2,209 | 2,181 | 2,188 | 2,212 | 2,245 |
| Natural gas | 1,647 | 1,697 | 1,637 | 1,558 | 1,560 | 1,594 | 1,588 |
| Five-year change in CO2 emissions (million metric tons) | |||||||
| Coal | -440 | -229 | -68 | -26 | -5 | -6 | |
| Petroleum | 182 | -15 | -28 | 6 | 24 | 34 | |
| Natural gas | 50 | -60 | -79 | 2 | 34 | -6 | |
| $25 Fee case | |||||||
| Fee in 2021$ per metric ton of CO2 | $0.00 | $27.56 | $35.18 | $44.90 | $57.30 | $73.13 | $93.34 |
| Fee in nominal dollars per metric ton of CO2 | $0.00 | $30.24 | $43.41 | $62.05 | $88.51 | $126.85 | $183.56 |
| Annual CO2 emissions (million metric tons) | |||||||
| Coal | 875 | 281 | 144 | 118 | 107 | 104 | 100 |
| Petroleum | 2,042 | 2,217 | 2,201 | 2,168 | 2,168 | 2,189 | 2,202 |
| Natural gas | 1,647 | 1,728 | 1,561 | 1,466 | 1,474 | 1,480 | 1,484 |
| Five-year change in CO2 emissions (million metric tons) | |||||||
| Coal | -594 | -137 | -26 | -11 | -3 | -4 | |
| Petroleum | 175 | -16 | -33 | 0 | 21 | 12 | |
| Natural gas | 81 | -167 | -95 | 8 | 6 | 4 | |
| $35 Fee case | |||||||
| Fee in 2021$ per metric ton of CO2 | $0.00 | $38.59 | $49.25 | $62.86 | $80.22 | $102.38 | $130.67 |
| Fee in nominal dollars per metric ton of CO2 | $0.00 | $42.42 | $60.80 | $86.98 | $124.26 | $178.30 | $258.16 |
| Annual CO2 emissions (million metric tons) | |||||||
| Coal | 875 | 221 | 133 | 116 | 105 | 104 | 99 |
| Petroleum | 2,042 | 2,210 | 2,194 | 2,156 | 2,150 | 2,156 | 2,174 |
| Natural gas | 1,647 | 1,726 | 1,510 | 1,427 | 1,412 | 1,425 | 1,432 |
| Five-year change in CO2 emissions (million metric tons) | |||||||
| Coal | -654 | -88 | -17 | -11 | -2 | -5 | |
| Petroleum | 168 | -16 | -38 | -6 | 5 | 18 | |
| Natural gas | 80 | -217 | -83 | -15 | 13 | 6 | |
| Data source: U.S. Energy Information Administration, Annual Energy Outlook 2022 | |||||||
Coal
In the United States, coal is mainly used as a thermal energy source in the electric power sector. It is also consumed to a lesser extent for on-site heat and electric power generation in the industrial and commercial sectors and as a feedstock for industrial iron and steel production. Coal is the most carbon-intensive of the major fossil fuels: it has an average intensity of about 96 kilograms (kg) of CO2/MMBtu of energy consumed. In the electric power sector, coal competes directly with natural gas (the least carbon-intensive fossil fuel [53 kg CO2/MMBtu of carbon intensity]), nuclear, and renewable generation. Because of coal’s high carbon intensity and readily available substitutes in the electric power sector, we project that coal consumption will greatly decrease between 2021 and 2025 in all carbon fee cases. We attribute the large decrease in coal-related CO2 emissions (Table 3) to decreases in coal-fired generation and generating capacity in the electric power sector. These retirements continue beyond 2025 although not as rapidly.
In the AEO2022 Reference case, many coal-fired electricity generating plants continue to operate under current laws and regulations, and coal-related CO2 emissions in the United States in 2050 are six times greater than in the carbon fee cases (Figure 2).
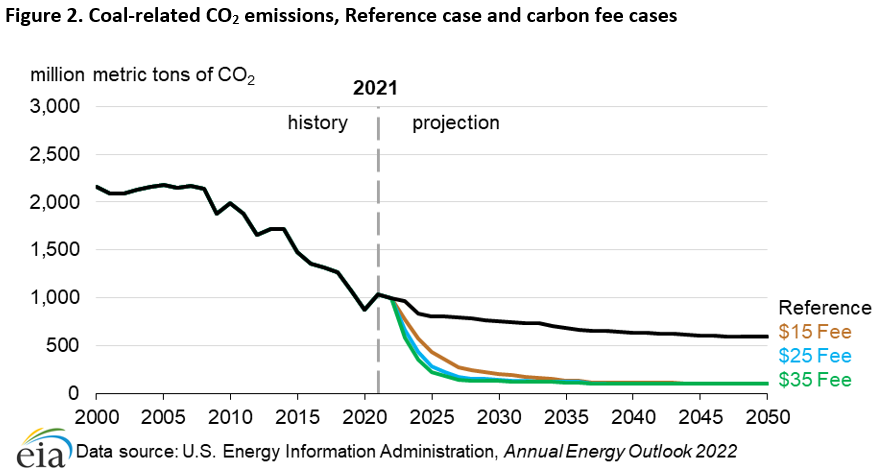
In the industrial sector, coal-related CO2 emissions decrease slightly after 2025—by 2% in the $15 Fee case, by 3% in the $25 Fee case (2 MMmt in each case), and by 4% in the $35 Fee case (4 MMmt). This smaller decline is because cost-effective substitutes for coal are not as readily available in certain industrial processes, such as iron and steel production. Low-cost fuel substitution has already taken place or will take place in the Reference case, so demand declines slightly in response to increasing coal prices due to the carbon fee.
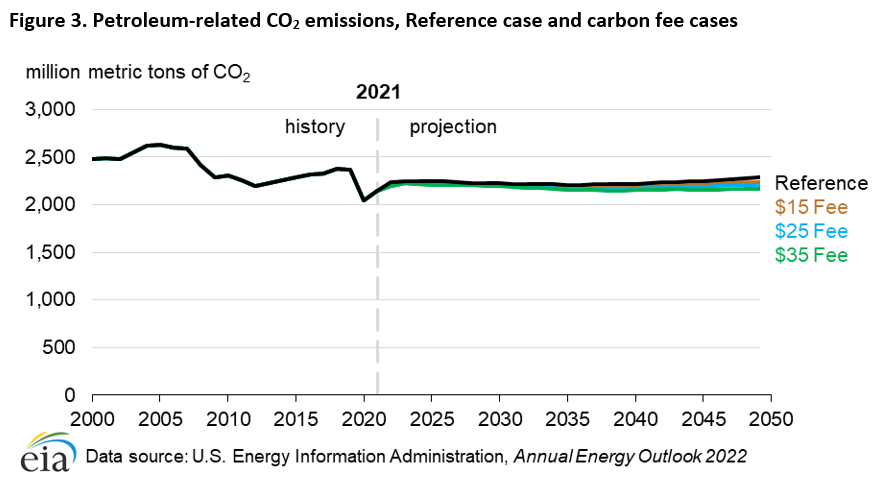
Petroleum
Petroleum is used in all sectors of the U.S. economy, but the transportation and industrial sectors use more petroleum than any other sectors. The carbon intensity of major petroleum products ranges from 71 kg CO2/MMBtu for motor gasoline, to 72 kg CO2/MMBtu for jet fuel, and 74 kg CO2/MMBtu for distillate fuel, which includes diesel fuels. In contrast with the electric power sector, the difference between our projections of U.S. petroleum consumption in the AEO2022 Reference case and in the carbon fee cases is relatively small because, even at $35, the carbon fees don’t provide enough incentive to prompt widespread fuel switching to less carbon-intensive alternatives. In 2050, CO2 emissions in the $35 Fee case will be 6% (128 MMmt) lower than in the Reference case (Figure 3). In the $35 Fee case, the carbon fee rises from zero to $1.12/gallon for gasoline and $1.31/gallon for diesel (Table 1). In dollars per gallon, the $35.00 carbon fee is approximately one-quarter of the projected gasoline price ($4.30/gallon) and diesel price ($4.90/gallon) in 2050. Nevertheless, petroleum remains the primary transportation fuel through 2050 in all cases.
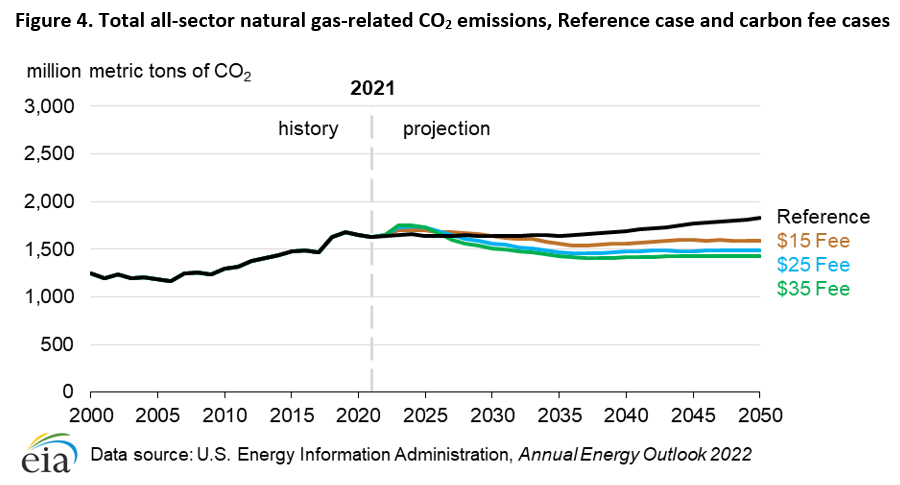
Natural gas
More natural gas was consumed in the U.S. electric power sector than in any other sector in 2021, followed closely by the industrial sector. Over the projection period, natural gas consumption in the industrial sector in the Reference case (including lease and plant fuel and natural gas converted to liquefied natural gas for export) becomes larger than natural gas consumption in the electric power sector as a result of increasing renewable generating capacity on the grid. Natural gas is also an important fuel in the residential and commercial sectors, primarily because of its use in space heating, water heating, and cooking. Because natural gas is the least carbon-intensive of the fossil fuels used to generate electricity, and because it is pervasively used across the U.S. economy, it responds differently to carbon fees than other fossil fuels.
U.S. natural gas-related CO2 emissions in all of the carbon fee cases exceed the Reference case until 2031 in the $15 Fee case, until 2028 in the $25 Fee case, and until 2027 in the $35 Fee case because of coal-to-natural gas switching in the electric power sector. Due to the relatively low carbon fees in the first several years of the projection period and the lag time associated with building additional renewable generating capacity, natural gas-fired generation from existing units continues to be economically competitive with coal, resulting in rising natural gas-related CO2 emissions. However, as the carbon fee increases over time, natural gas-fired generation and its associated CO2 emissions decrease across each carbon fee case. After 2030, we project natural gas-related CO2 emissions will remain below the Reference case in all carbon fee cases (Figure 4).
Electricity generating capacity additions, generation, and CO2 emissions
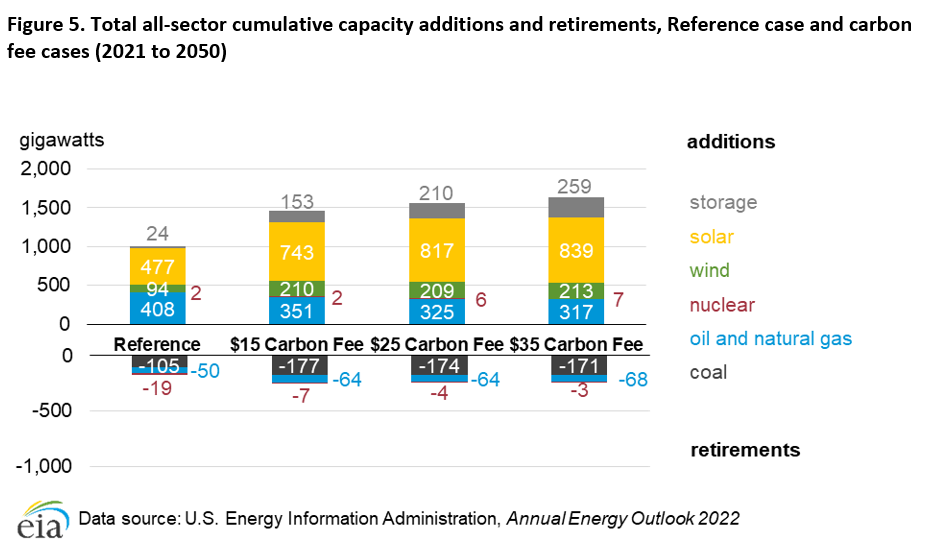
Introducing carbon fees to our AEO2022 Reference Case assumptions leads to additional coal-fired generating capacity retirements as operating costs increase (Figure 5). Natural gas-fired generating capacity is added to replace coal-fired capacity retirements in the near term, but ultimately, more natural gas-fired capacity is retired and less new capacity is added in the carbon fee cases compared with the Reference case. Less natural gas-fired capacity is added as the carbon fee increases, so rather than building new fossil fuel-fired capacity, we expect slightly more coal-fired capacity to be retained to meet regional capacity planning reserve requirements.3
In the carbon fee cases, we project that capacity additions from renewable energy, mostly solar and wind, as well as diurnal storage, will replace the retired coal and natural gas generating assets. Because renewable generation does not emit CO2, these sources become significantly more competitive relative to fossil fuel generation. Between 67% and 84% (382 gigawatts [GW] and 481 GW) of incremental solar and wind capacity and between 543% and 989% (129 GW and 235 GW) of incremental diurnal storage capacity are added compared with the Reference case projections by 2050. In each of the carbon fee cases, about 18% of renewable capacity additions through 2050 come from end-use sectors (primarily residential- and commercial-sector rooftop or other customer-sited solar installations), and nearly all of the total end-use renewable capacity added is solar photovoltaic. Altogether, installed wind, solar, and battery storage capacity exceed 1,300 GW by 2050 in the $35 carbon fee case, compared to around 600 GW of capacity in the AEO2022 Reference case.
The higher the carbon fee, not only is less nuclear power capacity retired, but new nuclear capacity is added (Figure 5). We project nuclear retirements of 7 GW in the $15 Fee case, 4 GW in the $25 Fee case, and 3 GW in the $35 Fee case compared with 19 GW of nuclear retirements in the AEO2022 Reference case. In addition, we project an additional 3 GW of new nuclear capacity in the $25 Fee case and 5 GW in the $35 Fee case above the 2 GW of planned nuclear capacity in the Reference case.
Natural gas-fired generation follows a relatively complex pattern in all carbon fee cases. As coal-fired generation declines after the carbon fee becomes effective, natural gas-fired generation increases because it is less carbon-intensive and costs less than coal, making it a more economical way to reduce CO2 emissions (Figure 6).
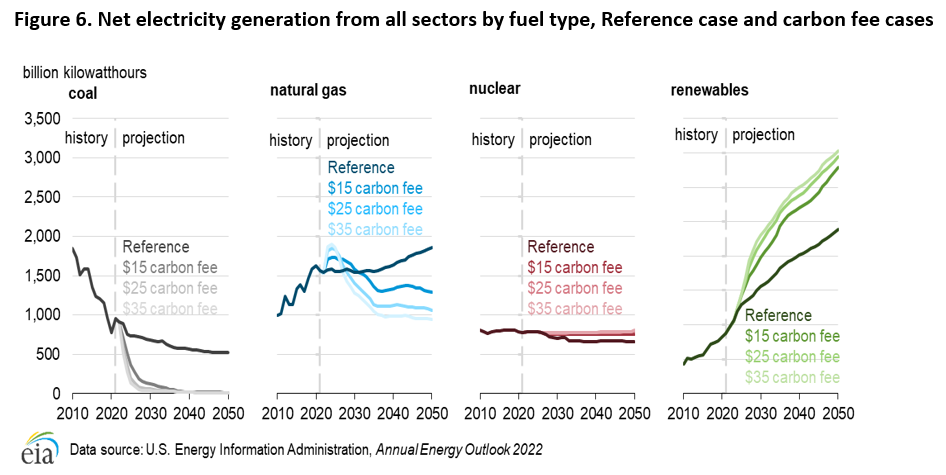
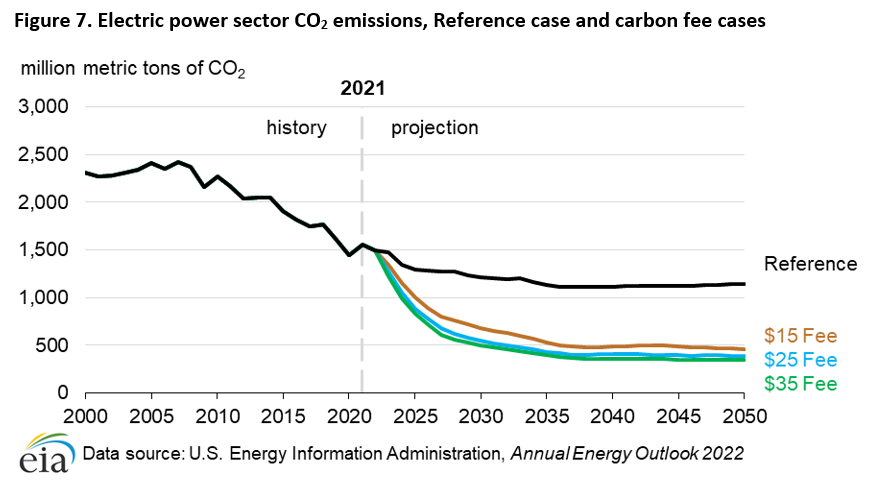
In the near term, the electric power sector responds to a carbon fee by switching from coal-fired to natural gas-fired generation. Starting in the late 2020s, the carbon fee cases add more renewables and diurnal storage capacity, leading to further CO2 reductions (Figure 7). CO2 emissions from the U.S. electric power sector in the AEO2022 Reference case continue to decline as natural gas replaces more coal in the generation mix because of continued low natural gas prices. In the AEO2022 Reference case, older and less efficient coal-fired generating capacity retires before 2025, but coal-fired capacity retirements slow as newer and more efficient units of the coal fleet remain. This transition leads to a decrease in CO2 emissions from coal-fired electricity generation during the first four years of the projection period that begins to level off thereafter. In contrast, in the carbon fee cases, more coal-fired generation retires throughout the projection period because carbon fees increase operating costs. By 2050, CO2 emissions from the electric power sector are 70% lower in the $35 Fee case than in the Reference case.
CO2 emissions by end-use sector
The electric power sector transforms primary energy into electric energy that is sold to consumers in the end-use sectors. We attribute electricity-related CO2 emissions to each end-use sector proportionally by electricity sales to that sector.
Residential sector
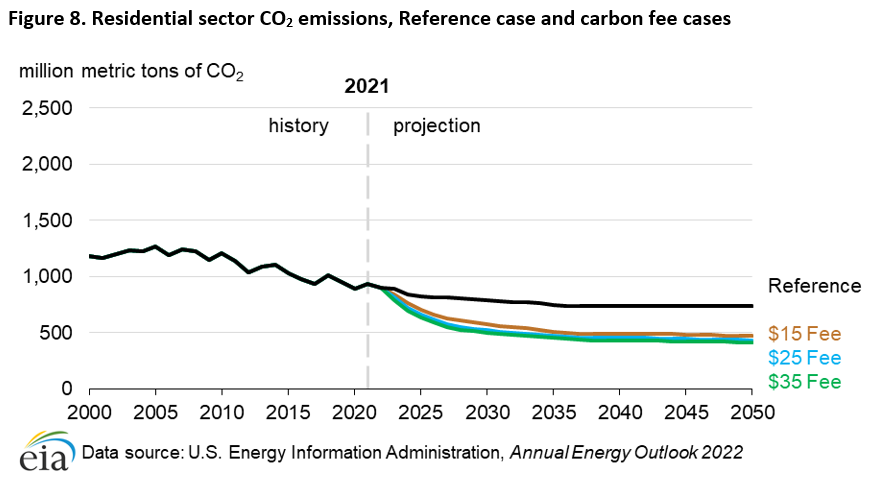
The U.S. residential sector consumed 5.1 quadrillion British thermal units (quads) of electricity in 2021, and electricity made up 44% of the sector’s total delivered energy consumption. Residential uses of electricity include space heating, space cooling, water heating, and refrigeration. Because of the U.S. residential sector’s large share of electric power consumption, changes in the carbon intensity of electricity greatly affect the sector’s response to carbon fees. In the $35 Fee case, of the 56% (519 MMmt) decline in energy-related CO2 in the residential sector during the projection period, 92% is due to the lower carbon intensity of electricity. Direct (non-electric) CO2 emissions from the residential sector decrease by 6%, from 326 MMmt in 2021 to 305 MMmt by 2050 in the AEO2022 Reference case. This drop in direct CO2 emissions is due to a decrease in demand for space heating (as a result of both efficiency gains and fewer anticipated heating degree days) and other improvements in household energy efficiency. Under the carbon fee cases, this decrease is amplified as heating fuels become relatively more expensive. Direct CO2 emissions declines by 9% by 2050 (to 296 MMmt) in the $15 Fee case, by 11% (to 290 MMmt) in the $25 Fee case, and by 13% (to 285 MMmt) in the $35 Fee case. Total U.S. residential sector CO2 emissions in 2050 in the $35 Fee case are 44% lower than in the AEO2022 Reference case (Figure 8).
Commercial sector
Electricity meets half of the U.S. commercial sector’s energy demand, especially for space cooling and refrigeration. As a result, nearly all of the 56% (433 MMmt) decline in commercial sector CO2 emissions by 2050 in the $35 Fee case is from the decline in electricity-related CO2 emissions. CO2 emissions from the commercial sector, not including electricity use, increase by 5%, from 245 MMmt in 2021 to 259 MMmt by 2050, in the AEO2022 Reference case. This increase is due to the sector’s rising use of natural gas, particularly for cooking and water heating. In contrast, these CO2 emissions decrease by 2050 in the carbon fee cases by 1% (to 244 MMmt) in the $15Fee case, 4% (to 236 MMmt) in the $25 Fee case, and 6% (to 229 MMmt) in the $35 Fee case due to the relative increase in fuel prices. In the $35 Fee case, energy-related commercial CO2 emissions are 45% lower than in the AEO2022 Reference case in 2050 (Figure 9).
Industrial sector
The U.S. industrial sector uses a variety of fuels, but natural gas is used the most, followed by petroleum products. Electricity purchases make up 13% of industrial energy use. Energy-related CO2 emissions from the industrial sector decrease 14% from 2021 to 2050 in the $35 Fee case compared with a 6% increase over the same period in the AEO2022 Reference case. In the $35 Fee case, CO2 emissions fall 19% below the Reference case to around 1.2 billion metric tons (Bmt). Although CO2 emissions are lower in the carbon fee cases than in the Reference case, percentage differences are smaller than in the residential and commercial sectors (Figure 10). Industrial sector CO2 emissions begin increasing in the mid-2030s in the Reference case and the carbon fee cases as industrial gross output continues to rise with increasing GDP.
The response to carbon fees varies by industry. Relatively energy-intensive industries without readily available fuel substitutes, such as in the bulk chemicals and refining industries, show that carbon fees have a relatively small effect on reducing CO2 emissions. For example, in the $35 Fee case, CO2 emissions from the bulk chemicals industry increase by 20% between 2021 and 2050 compared with a 35% increase during the same period in the Reference case. Other industries, such as food product manufacturing, show a more substantial response to carbon fees. CO2 emissions from manufacturing food products decrease 39% from 2021 to 2050 in the $35 Fee case, compared with a 16% decrease during the same period in the Reference case.
Transportation sector
Three modes of transportation account for 84% of the energy consumed in the U.S. transportation sector in the AEO2022 Reference case: light-duty vehicles (LDV), which consumed 14.3 quads of energy in 2021; freight trucks, which consumed 5.6 quads; and air travel, which consumed 2.3 quads. Compared with other sectors of the economy, consumers in the transportation sector rarely change their consumption behavior because of changes in fuel prices. Because commutes typically don’t change in response to energy price changes and consumers have limited readily available fuel alternatives or transportation options, their consumption patterns tend to remain relatively unchanged. Therefore, CO2 emissions are relatively insensitive to carbon fees at the levels assumed in this analysis. With limited alternative fuels, air travel demand is especially insensitive to carbon fees, which is why 2050 air travel CO2 emissions are about the same across all cases. By 2050, transportation sector CO2 emissions in the $35 Fee case are 7%, or 129 MMmt, lower than in the Reference case (Figure 11).
CO2 emissions associated with LDVs rise 2% from 2021 to 2050 in the Reference case and fall 6% in the $35 Fee case (Table 4 and Figure 11). CO2 emissions from freight trucks decline by 2% by 2050 in the Reference case and decline by 12% in the $35 Fee case. Air travel CO2 emissions increase more than 80% from 2021 to 2050 in both the Reference and the $35 Fee cases. CO2 emissions from all other transportation modes combined decrease by 2% by 2050 in the AEO2022 Reference case and by 6% in the $35 Fee case.
Table 4. Total percentage change in CO2 emissions by transportation type and case, 2021–2050
| Types of transportation | Reference case | $15 Fee case | $25 Fee case | $35 Fee case |
|---|---|---|---|---|
| Light-duty vehicles | 2% | -2% | -4% | -6% |
| Freight trucks | -2% | -6% | -11% | -12% |
| Air travel | 83% | 83% | 82% | 82% |
| All other | -2% | -4% | -6% | -6% |
| Total | 9% | 5% | 3% | 1% |
| Data source: U.S. Energy Information Administration, Annual Energy Outlook 2022 | ||||
Petroleum remains the fuel used most in transportation, and internal combustion engine (ICE) vehicles remain the main vehicle type in 2050 across all cases. Even so, electricity used as a transportation fuel and electric vehicle adoption both increase over the projection period across all cases. In each case, electricity sales to the transportation sector grow around 9% annually, on average, from 2021 to 2050. Between 2021 and 2050, LDV motor gasoline consumption declines between 2% (282 trillion Btu [TBtu]) and 6% (808 TBtu), and LDV electricity consumption increases between 3% (15 TBtu) and 16% (71 TBtu) because of increases in electric vehicle sales, increases in fuel economy, and decreases in travel.
In the Reference case, the stock of light-duty electric cars grows from 1% (1.1 million) of all cars in 2021 to 9% (6.7 million) of all cars, in 2050. Similarly, the stock of electric light-duty trucks grows from 0.2% (230,000) of all trucks in 2021 to 6% (12.2 million)of all trucks in 2050. The stocks of light-duty electric cars and trucks are greater by 2050 in the $35 Fee case, reaching 11% (9.0 million) of all cars and 7% (13.5 million) of all trucks. In 2050, 1.5 million electric LDVs are sold in the Reference case and 2.0 million electric LDVs are sold in the $35 Fee case, up from 0.3 million in 2021.
Electricity
Retail electricity prices increase sharply after carbon fees become effective in 2023 and then remain relatively stable over the projection period. Compared with the AEO2022 Reference case, the average retail electricity price rises sharply in the carbon fee cases between 2022 and 2023 in tandem with the average natural gas price. The price remains higher than in the Reference case throughout the projection period, even with more generation from zero marginal cost renewable capacity. Between 2023 and 2050, average electricity prices are 8% higher in the $15 Fee case, 12% higher in the $25 Fee case, and 15% higher in the $35 Fee case compared with the Reference case (Table 5).
Table 5. Average delivered electricity prices to all sectors, Reference and carbon fee cases
| Cases | 2021 | 2025 | 2030 | 2035 | 2040 | 2045 | 2050 |
|---|---|---|---|---|---|---|---|
| Reference | 11 | 10 | 11 | 11 | 11 | 10 | 10 |
| $15 Fee | 11 | 11 | 11 | 11 | 11 | 11 | 11 |
| $25 Fee | 11 | 12 | 12 | 12 | 12 | 12 | 12 |
| $35 Fee | 11 | 12 | 12 | 12 | 12 | 12 | 12 |
| Data source: U.S. Energy Information Administration, Annual Energy Outlook 2022 Note: Our analysis of the past AEO publications, provided in the Annual Energy Outlook Retrospective Review, suggests that the average absolute difference between projected and realized electricity prices has been about 1 cent per kilowatthour for years, subject to at least a dozen AEO projections. The price differences observed across cases in the table do not always exceed the uncertainty we have observed between our Reference case projections and observed prices. |
|||||||
Fossil fuels
Carbon fees affect coal prices more than other fuels. Coal prices are more than eight times higher in the $35 Fee case in 2050 than in the AEO2022 Reference case (Table 6). Even as the demand for coal decreases in the carbon fee cases, which puts downward pressure on coal prices, carbon fees increase the final coal prices. Across all carbon fee cases, the fees have their second-greatest effect on natural gas prices as a result of a combination of the carbon fee and the sustained demand for natural gas, especially in the early part of the projection period.
Table 6. National average delivered energy prices to all users for select years and fossil fuel products, Reference and carbon fee cases
| Cases | 2021 | 2025 | 2030 | 2035 | 2040 | 2045 | 2050 |
|---|---|---|---|---|---|---|---|
| Reference case | |||||||
| Motor gasoline | $26 | $22 | $23 | $25 | $26 | $26 | $27 |
| Jet fuel | $15 | $16 | $16 | $17 | $18 | $19 | $20 |
| Distillate | $23 | $22 | $22 | $23 | $24 | $25 | $25 |
| Natural gas | $7 | $6 | $6 | $6 | $6 | $6 | $6 |
| Coal | $2 | $2 | $2 | $2 | $2 | $2 | $2 |
| $15 Fee case | |||||||
| Motor gasoline | $26 | $23 | $25 | $26 | $28 | $29 | $30 |
| Jet fuel | $15 | $17 | $18 | $19 | $21 | $22 | $23 |
| Distillate | $23 | $23 | $24 | $25 | $27 | $28 | $29 |
| Natural gas | $7 | $6 | $7 | $7 | $8 | $8 | $9 |
| Coal | $2 | $4 | $4 | $5 | $6 | $7 | $8 |
| $25 Fee case | |||||||
| Motor gasoline | $26 | $24 | $26 | $28 | $29 | $32 | $33 |
| Jet fuel | $15 | $18 | $19 | $21 | $22 | $25 | $26 |
| Distillate | $23 | $24 | $25 | $27 | $28 | $30 | $32 |
| Natural gas | $7 | $7 | $7 | $8 | $9 | $10 | $11 |
| Coal | $2 | $5 | $6 | $7 | $8 | $10 | $12 |
| $35 Fee case | |||||||
| Motor gasoline | $26 | $25 | $27 | $29 | $31 | $33 | $36 |
| Jet fuel | $15 | $18 | $20 | $22 | $24 | $27 | $29 |
| Distillate | $23 | $25 | $26 | $28 | $30 | $33 | $35 |
| Natural gas | $7 | $8 | $8 | $9 | $10 | $11 | $13 |
| Coal | $2 | $6 | $7 | $9 | $10 | $13 | $15 |
| Data source: U.S. Energy Information Administration, Annual Energy Outlook 2022 | |||||||
Carbon capture, utilization, and storage
Carbon fees increase the cost of emitting CO¬2, which provides an incentive for CO2 emitters to use less carbon-intensive fuels or take other actions that reduce CO2 emissions. Carbon capture, utilization, and storage technologies provide fuel producers another option for reducing CO2 emissions, resulting in lower costs associated with carbon fees. In the AEO2022, we assume CO2 can be captured from some industrial processes and electric power generation and can then be sold to enhanced oil recovery (EOR) operations or stored in saline aquifers. Industrial sector CO2 can be captured from a variety of subsectors, but we assume that all of it comes from ethanol and natural gas processing in the AEO2022 Reference case and the carbon fee cases.
Projects that capture and permanently sequester CO2 in geologic storage or for EOR use are eligible for a tax credit (Section 45Q of the Internal Revenue Code). The value of the tax credit increases over time and depends on a number of factors, including the date the project begins service and whether the CO2 is stored or used for EOR. The Section 45Q tax credit is available to both electric power and industrial sources of CO2 for the first 12 years of a project’s lifespan.
The value of Section 45Q tax credits in 2020 was $20 per mt for EOR and $32/mt for saline storage, increasing to $35/mt and $50/mt in 2026, respectively, and increasing with inflation thereafter. Section 45Q tax credit payments end in 2042 and only apply to CO2 originating from anthropogenic sources (caused by human activity rather than derived from natural sources). We apply Section 45Q tax credits to the AEO2022 Reference case and to the three carbon fee cases.
CO2 captured from the industrial sector and purchased for EOR exhibits an inverted-U shape over the projection period in all cases, reaching a peak of around 16 MMmt in 2035 (Figure 12). In 2035, ethanol and natural gas processing each account for about half of the total captured CO2 from the industrial sector. CO2 capture from the industrial sector rises until around 2035 because of increases in the value of the Section 45Q tax credits for EOR as well as increased natural gas and ethanol consumption. Captured CO2 in the industrial sector declines in the latter half of the projection period after Section 45Q tax credits expire, making EOR less economical.
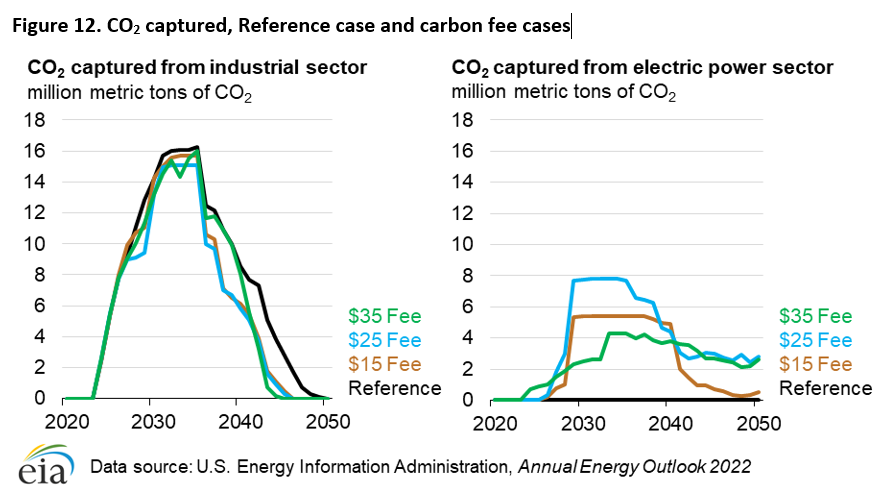
In the $35 Fee case, CO2 purchased for EOR that originates from anthropogenic sources (industrial and electric power sectors) reaches about 20 MMmt in 2035, and most of the additional CO2 relative to the Reference case comes from electric power plants. In the 2030s, more CO2 is captured from electric power plants in the $15 Fee and $25 Fee cases than in the $35 Fee case because coal-fired power plants are retired at a much faster rate in the $35 Fee case. More than half of the captured CO2 from the electric power sector in the 2030s comes from retrofits to existing coal-fired power plants in the $15 Fee and $25 Fee cases, as opposed to none in the $35 Fee case.
Saline storage increases in the first half of the 2030s in the $15 Fee and $25 Fee cases, rising to 5 MMmt and 7 MMmt, respectively, before falling close to zero in the second half of the projection period, after Section 45Q tax credits expire. Much of the CO2 stored in saline aquifers in the $15 Fee and $25 Fee cases is captured from coal-fired power plants. In the $35 Fee case, very little captured CO2 is stored in saline aquifers because coal-fired power plants are not generating much electricity. However, some saline storage begins to be used in 2045, reaching 2 MMmt by 2050 in the $35 Fee case.
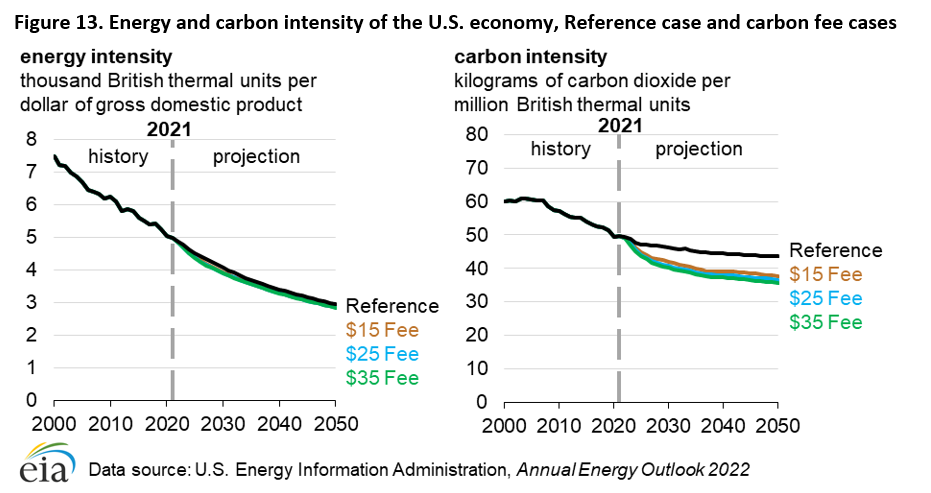
Energy and carbon intensity
In the carbon fee cases, both the carbon intensity of energy sources and the energy intensity of the economy in the United States decline relative to the AEO2022 Reference case (Figure 13). The carbon intensity (kg CO2/MMBtu) declines 12% from 2021 to 2050 in the Reference case and 28% in the $35 Fee case. Carbon fees provide an incentive to switch from more carbon-intensive fuels to less carbon-intensive alternatives, leading to an overall lower carbon intensity.
The energy intensity of the economy (which we measure in units of thousand British thermal units per dollar of GDP) declines 41% from 2021 to 2050 in the Reference case and 43% in the $35 Fee case. Carbon fees result in a slightly lower energy intensity than in the Reference case because they increase energy prices, which reduces demand for energy products and increases energy efficiency. The small differences between the carbon fee cases and the Reference case illustrate that the declines in energy intensity are driven primarily by an ongoing shift toward less energy-intensive economic activity.
Macroeconomic growth cases
In the preceding sections of this report, we discussed how introducing $15, $25, and $35 carbon fees affects energy-related CO2 projections, using the AEO2022 Reference case as a baseline. In this section, we analyze how these projections vary when a carbon fee is instead added to baselines using alternative macroeconomic growth assumptions. In this analysis, we apply a $35 carbon fee to the AEO2022 Low Economic Growth and High Economic Growth cases.
The Low Economic Growth and High Economic Growth cases explore the uncertainty around economic growth rates. These cases vary population and nonfarm labor productivity growth assumptions, yielding changes to macroeconomic indicators such as nonfarm employment, real disposable income, and real GDP (Table 7).
Table 7. Macroeconomic growth rates in the AEO2022 Low Economic Growth, Reference, and High Economic Growth cases
| Compound annual growth rate, 2021–2050 |
Low Economic Growth case |
Reference case |
High Economic Growth case |
|---|---|---|---|
| Population | 0.40% | 0.50% | 0.70% |
| Nonfarm labor productivity | 1.40% | 1.90% | 2.40% |
| Nonfarm employment (labor force) | 0.50% | 0.60% | 0.80% |
| Real disposable income per capita | 1.60% | 1.70% | 1.70% |
| Real gross domestic product | 1.80% | 2.20% | 2.70% |
| Data source: U.S. Energy Information Administration, Annual Energy Outlook 2022 | |||
Without the carbon fee assumptions, the High Macroeconomic Growth case projects higher CO2 emissions due to increased energy consumption. In that case, energy-related CO2 emissions rise 11% more than in the Reference case (from 4.8 Bmt in 2021 to 5.3 Bmt in 2050). Most of this growth occurs in the second half of the projection period. In the Low Macroeconomic Growth case, CO2 emissions fall due to decreased consumption associated with lower levels of economic activity. In this case, CO2 emissions fall to 8% less than in the Reference case (4.4 Bmt) in 2050.
In the carbon fee cases, carbon fees result in long-term reductions in energy-related CO2 emissions across all economic sectors and fossil fuels. Higher carbon fees lead to a larger decrease in CO2 emissions. When we apply the $35 carbon fee to the Low Economic Growth case, the effects are magnified; projected CO2 emissions decrease as a result of higher prices for fossil fuels, and consumption decreases as a result of slower economic growth. Combining assumptions from the Low Economic Growth case and $35 Fee case leads to more reductions in CO2 emissions than either the Low Economic Growth case or $35 Fee case on their own.
When we apply a $35 carbon fee to the High Macroeconomic Growth case, the results vary. When a carbon fee increases prices on fossil fuels relative to alternative fuels, it results in fuel switching to lower-carbon fuels, which decreases CO2 emissions. However, more energy consumption driven by higher macroeconomic growth in this case increases CO2 emissions. The net impact of these combined effects can differ across fuels and economic sectors because these effects depend on the sensitivity that consumers and producers in each sector have to price changes, which, in turn, depend on underlying determinants, as discussed in earlier sections of this analysis.
Table 8. Change in total energy-related CO2 emissions, AEO2022 carbon fee and macroeconomic growth cases (2050)
| Sector or fuel | $35 Fee | Low Economic Growth | High Economic Growth | Low Economic Growth + $35 Fee | High Economic Growth + $35 Fee |
|---|---|---|---|---|---|
| Sector | |||||
| Residential | -7% | -2% | 2% | -9% | -4% |
| Commercial | -11% | -2% | 2% | -13% | -9% |
| Industrial | -6% | -10% | 17% | -15% | 8% |
| Transportation | -6% | -9% | 13% | -15% | 6% |
| Electric power | -70% | -6% | 7% | -71% | -69% |
| Fuel | |||||
| Petroleum | -6% | -9% | 13% | -14% | 6% |
| Natural gas | -22% | -7% | 10% | -28% | -15% |
| Coal | -83% | -7% | 9% | -85% | -82% |
| Total | -22% | -8% | 11% | -28% | -13% |
| Data source: U.S. Energy Information Administration, Annual Energy Outlook 2022 | |||||
Total energy-related CO2 emissions in 2050 are 11% higher in the High Economic Growth case and 8% lower in the Low Economic Growth case relative to the AEO2022 Reference case. Projected energy-related CO2 emissions decrease when we apply a $35 carbon fee to the High Economic Growth and Low Economic Growth cases. Total energy-related CO2 emissions under the High Economic Growth and Low Economic Growth cases with a $35 carbon fee are, in both cases, 22% lower than in the High Economic Growth and Low Economic Growth cases without a carbon fee in 2050 (Figure 14).
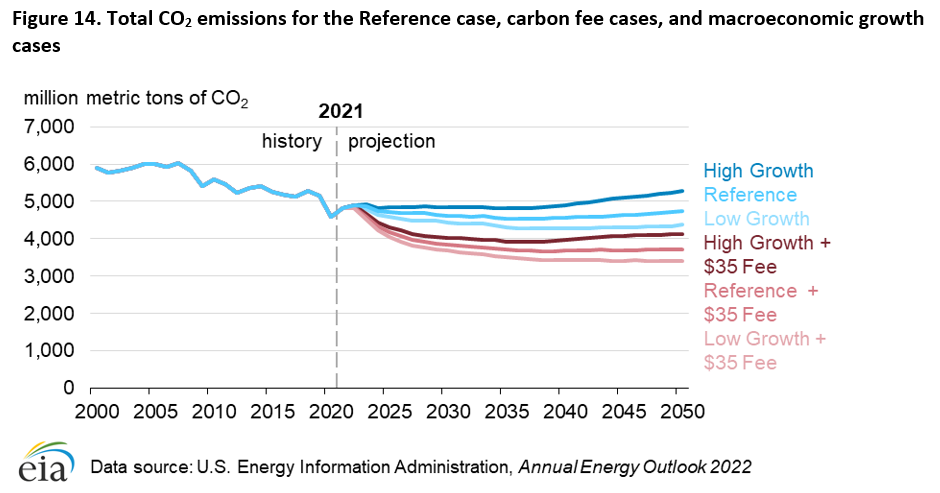
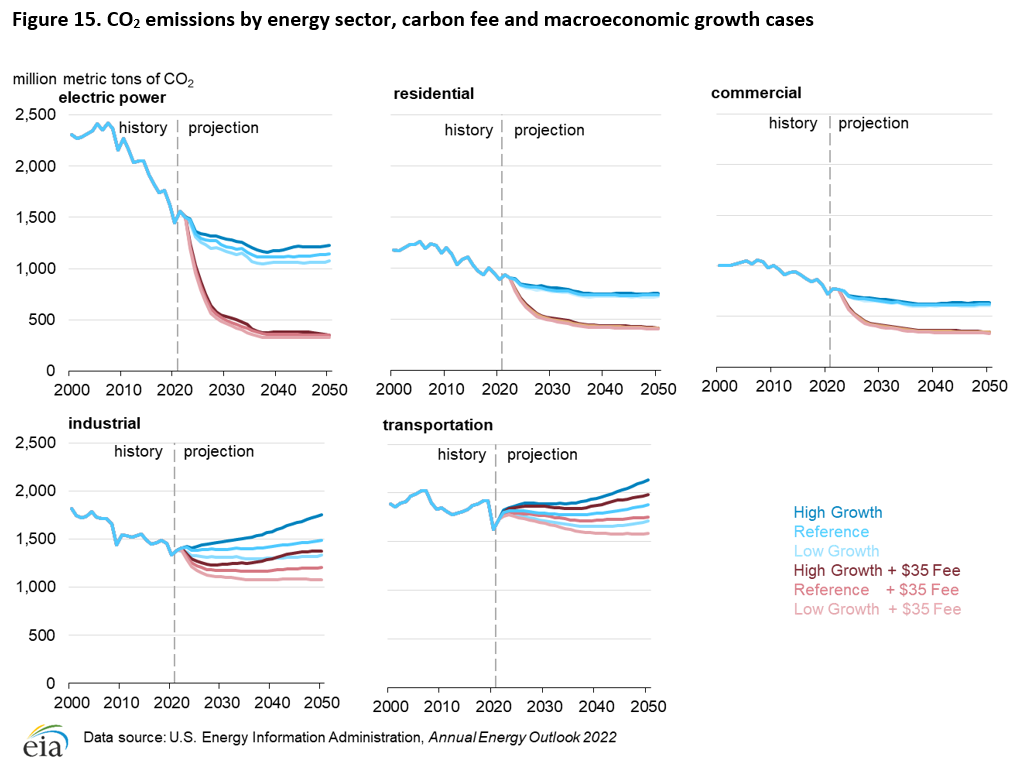
The combined Low Economic Growth and $35 Fee case produces fewer CO2 emissions in 2050 than in either the $35 Fee case or the Low Economic Growth case on their own. This result is true for all sectors and for all fuels (Figure 15). Less overall energy consumption in the Low Economic Growth case and higher prices for fossil fuels in the $35 Fee case both reduce CO2 emissions, although in the electric power sector, the decrease in CO2 emissions is determined mostly by the carbon fee because it creates an incentive to increase fuel switching to lower CO2-emitting fuels.
The levels of CO2 emissions in the combined High Economic Growth and $35 Fee case differ by energy sector. For the residential, commercial, and electric power sectors, CO2 emissions decline because the decreased demand caused by higher energy prices outweighs the increase in demand caused by stronger economic growth, resulting in a net decrease in CO2 emissions (Figure 15). For the industrial and transportation sectors, the increase in CO2 emissions resulting from increased demand outweighs the decrease in demand resulting from higher energy prices, creating a net increase in CO2 emissions. With regard to fuel types, combining strong macroeconomic growth with a carbon fee leads to a net decrease in both coal and natural gas CO2 emissions, but it leads to a net increase in petroleum CO2 emissions. This difference occurs mostly because of the availability, or lack of availability, of fuel substitutes. Coal and natural gas are used largely for electricity generation and have readily available low-emission substitutes, such as solar or wind power. Petroleum is used predominantly in vehicles and industrial processes where lower-carbon substitutes are either more expensive or not widely available.
Conclusion
In the three AEO2022 carbon fee cases, we apply hypothetical fees of $15, $25, or $35 (in 2021 dollars per metric ton of CO2) on fossil fuels in the United States, starting in 2023, and increase those fees by 5% each year through 2050. The results of the carbon fee cases demonstrate that charging an additional fee on fossil fuels proportional to their carbon content leads to significant differences in projected energy prices, fuel consumption, carbon capture and sequestration, carbon intensity, and overall energy-related CO2 emissions relative to the AEO2022 Reference case.
Our projections of U.S. energy-related CO2 emissions are lower when a carbon fee is applied to fossil fuels, and higher fees result in larger reductions in CO2 emissions relative to the Reference case. Total energy-related CO2 emissions in 2050 are progressively lower under the $15 Fee (17%), $25 Fee (20%), and $35 Fee (22%) cases than in the AEO2022 Reference case.
The effect of carbon fees on emission projections differs by energy sector and fuel type. CO2 emissions from the electric power sector are the most responsive to carbon fees, and CO2 emissions from the transportation sector are the least responsive. By 2050, electric power sector CO2 emissions are 70% lower in the $35 Fee case than in the Reference case, and transportation sector CO2 emissions are 7% lower. These sectoral differences occur because the assumed level of carbon fees is sufficient to accelerate coal-to-natural gas switching for electric power generation and make renewables and battery storage more economically competitive as replacement generation capacity. The carbon fees, however, are insufficient to displace petroleum products from their role as the primary source of transportation energy. Such dynamics affect each economic sector and fuel to varying degrees.
Combining carbon fee assumptions with high and low macroeconomic growth assumptions leads to less total CO2 emissions relative to the macroeconomic growth cases alone; however, these reduced CO2 emissions also vary across fuels and sectors. In isolation, the High Macroeconomic Growth case results in more energy-related CO2 emissions than in the AEO2022 Reference case due to a larger population, stronger economic activity, and greater wealth. The opposite is true for the Low Macroeconomic Growth case. Applying a carbon fee to the Low Macroeconomic Growth case assumptions leads to a net decrease in CO2 emissions across all sectors and fuels. Applying a carbon fee to the High Macroeconomic Growth case assumptions results in both net increases and decreases in energy-related CO2 at the sector level, depending on the availability of fuel substitutes.
Footnotes
- https://nca2018.globalchange.gov/
- https://unfccc.int/sites/default/files/NDC/2022-06/United%20States%20NDC%20April%2021%202021%20Final.pdf/
- Capacity added or retained to meet planning reserve margins is typically not expected to generate much electricity and so has a negligible impact on overall CO2 emissions.
- In the AEO2022, we assume all CO2 captured in the industrial sector is used for EOR. CO2 captured from electric power plants can be used for either EOR or stored in saline aquifers.