Trends in Lighting in Commercial Buildings
CBECS 2012 - Release date: May 17, 2017
This report uses information from EIA’s Commercial Buildings Energy Consumption Survey (CBECS) to review trends in commercial lighting. CBECS data collection is an inherently complex and time-consuming process. The latest CBECS considers a sample of buildings designed to be representative of all commercial buildings in 2012. On-site surveys of the sampled buildings were conducted from April through November of 2013, and energy bill data for those buildings was collected in 2014. Starting in 2014 and continuing into 2015, EIA published data on the characteristics of the buildings and in mid-2015 issued a public use building characteristics file. Data on energy use and expenditures with end-use detail was released in 2016 following extensive analysis to relate characteristics of buildings to their energy bills.
This report uses data from the most recent CBECS in 2012 and earlier editions of the CBECS to examine trends in commercial building lighting.
Introduction
According to the most recent Commercial Buildings Energy Consumption Survey (CBECS), 17% of all electricity consumed in U.S. commercial buildings is for lighting, making it the largest end use of electricity besides the Other category. Lighting is an area where improvements in energy efficiency are often sought. The advent of new lighting technologies and changes to lighting efficiency standards have contributed to steep reductions in the percentage of electricity used by commercial buildings for lighting since the prior CBECS in 2003.
The CBECS includes specific questions on types of lighting equipment used, the amount of floorspace with lighting (lit floorspace) per building, and the percentage of lit floorspace by type of equipment—as well as other building characteristics and energy consumption data. EIA applies engineering-based statistical models to characteristics data to break out energy consumption into end uses, including lighting. The latest CBECS collected new information on lighting controls and lighting strategies, which are discussed in the final section of this report.
The latest CBECS collected information on seven types of lighting:
- Standard fluorescent
- Compact fluorescent (CFL)
- Incandescent
- High-intensity discharge (HID)
- Halogen
- Light-emitting diode (LED)
- Other lighting types
Each of these lighting types has characteristics that make them best suited to specific lighting needs.1 Fluorescent lamps and compact fluorescent lamps are more energy efficient and have longer life spans than incandescent bulbs. However, incandescent bulbs usually produce light that renders colors so that they look the same under the light as they do in daylight so consumers may prefer them in certain situations. Halogen lamps are a category of incandescent bulb that offer high-quality light with increased energy efficiency. High-intensity discharge lamps produce very bright light, making them useful for lighting large areas and, as such, they are commonly used in high-ceiling spaces with open layouts such as sports arenas, storage areas, and big-box retail stores. LED lighting was a new category for the latest CBECS questionnaire. LEDs are a highly efficient and durable type of directional lighting that is rapidly evolving to produce the quality of light consumers expect.
The Other lighting category includes less common bulb types, many of which have particular uses, such as germicidal lights, laser lights, and neon lights. The use of bulbs in the Other lighting category is so specialized that not enough data are available to summarize in the CBECS, and so they are not discussed in the following sections.
| Efficacy (lumens/Watt) |
Typical rated lifetime (hours) |
Color rendering index2 |
|
|---|---|---|---|
| Standard fluorescent | |||
| Fluorescent - T5 | 25 - 55 | 6,000 - 7,500 | 52 - 75 |
| Fluorescent - T8 | 35 - 87 | 7,500 - 20,000 | 52 - 90 |
| Fluorescent - T12 | 35 - 92 | 7,500 - 20,000 | 50 - 92 |
| Compact fluorescent | 40 - 70 | 10,000 | 82 |
| Incandescent | 10-19 | 750 - 2,500 | 97 |
| High-intensity discharge | |||
| Mercury vapor | 25 - 50 | 29,000 | 15 - 50 |
| Metal halide | 50 - 115 | 3,000 - 20,000 | 65 - 70 |
| High-pressure sodium | 50 - 124 | 29,000 | 22 |
| Halogen | 14 - 20 | 2,000 - 3,500 | 99 |
| LED | 20 - 100 | 15,000 - 50,000 | 33-97 |
| 1 Efficacy is a measure of how well a light source turns input power into the desired output, which is lumens. Theoretical maximum luminous efficacy of white light is 220 lumens/Watt. 2 Color Rendering Index (CRI) indicates a lamp's ability to show natural colors. The highest possible CRI value is 100, which would be equivalent to daylight. Source: 2011 Buildings Energy Data Book, Table 5.6.9, Office of Energy Efficiency and Renewable Energy, U.S. Department of Energy (buildingsdatabook.eren.doe.gov) |
|||
Measures of lighting use
CBECS is the only national study that provides estimates for the number of commercial buildings, the amount of total floorspace in these buildings, and the amount of floorspace that is lit. Respondents identify the types of bulbs used in their building, then they report the share of lit floorspace covered by each bulb type.
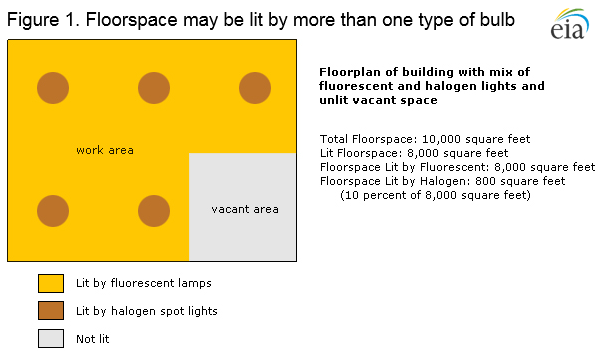
The commercial buildings stock comprises 87,093 million square feet of which 83,569 million square feet (96%) are in buildings that use lighting of which 68,729 million square feet of that space is lighted (82%). Some spaces may be lit by more than one type of lighting such as an office that uses overhead standard fluorescent lighting with supplemental incandescent task lights (Figure 1).
Slightly less than 10% of commercial buildings do not have any type of lighting. Buildings that do not normally use any lighting are vacant buildings, warehouses, and vehicle storage buildings.2
The total area lit by each of the six lighting types is shown in the far right column of Table 2 and is a valuable metric for measuring lighting coverage within buildings by bulb type. This measure is shown in this report, but not the summary data tables from the CBECS.
Table 2. Measures of lighting by type of lighting, 2012
| Buildings (thousand) | Total floorspace1 (million square feet) | Total lit floorspace2 (million square feet) | Total floorspace lit by each lighting type (million square feet) | |
|---|---|---|---|---|
| All buildings | 5,557 | 87,093 | 68,729 | NA |
| Buildings with lighting | 5,025 | 83,569 | 68,729 | NA |
| Lighting equipment types (more than one may apply) | ||||
| Standard fluorescent | 4,649 | 80,081 | 66,088 | 53,490 |
| Compact fluorescent | 2,302 | 53,816 | 45,420 | 9,113 |
| Incandescent | 1,826 | 38,406 | 32,035 | 4,071 |
| High-intensity discharge (HID) | 525 | 23,396 | 20,039 | 3,527 |
| Halogen | 905 | 28,059 | 23,727 | 2,973 |
| LED | 473 | 22,071 | 18,934 | 1,957 |
| Other | 10 | 446 | 411 | Q |
| 1 Total floorspace refers to all floorspace in lit buildings, including the floorspace that was not lit. 2 Lit floorspace refers only to the portion of the floorspace in these buildings that was reported to be lit. Q = Data withheld either because the Relative Standard Error (RSE) was greater than 50% or because fewer than 20 buildings were sampled. Source: U.S. Energy Information Administration, 2012 Commercial Buildings Energy Consumption Survey. |
||||
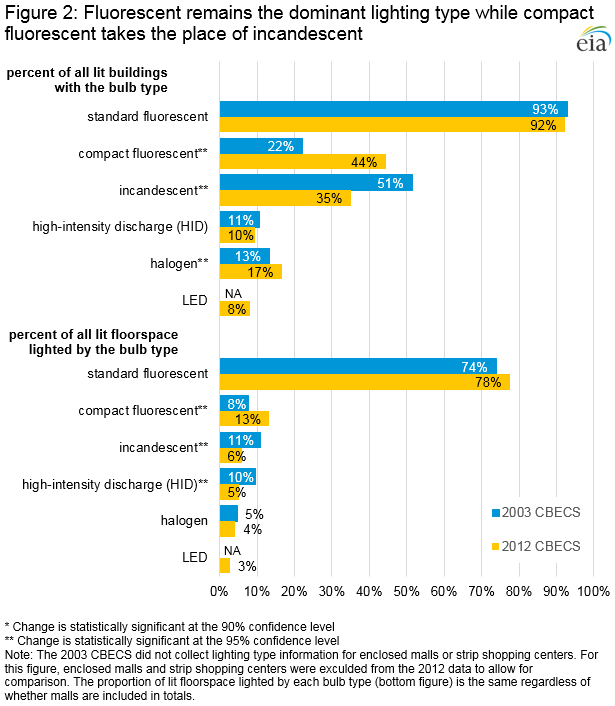
Standard fluorescent lighting is by far the most commonly used type of lighting: 93% of commercial buildings that use lighting (lit buildings) use standard fluorescent lights, and 78% of lit floorspace is illuminated by standard fluorescents. Compact fluorescent (CFL) has become the second most common lighting type, providing light to 13% of all lit space in commercial buildings. CFLs most often replace incandescent bulbs, a lighting type that has decreased in use since 2003. The remaining lighting types—incandescent, high-intensity discharge, halogen, and light-emitting diode (LED)—each light less than 10% of lit floorspace across all commercial buildings (Figure 2).
Energy consumed by lighting
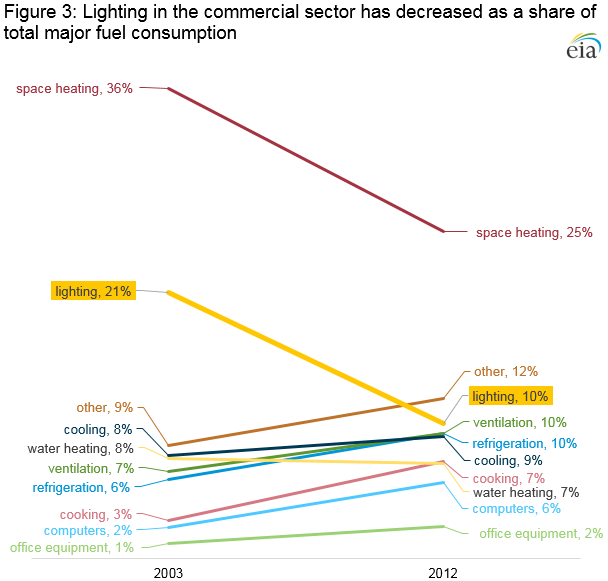
Although lighting continues to use a large proportion of the total energy consumed by commercial buildings, the amount of energy used for lighting decreased substantially with the adoption of more efficient lighting technologies that are increasingly economical. In 2012, lighting used 10% of the total site energy consumed by commercial buildings compared to 21% in 2003 (Figure 3).
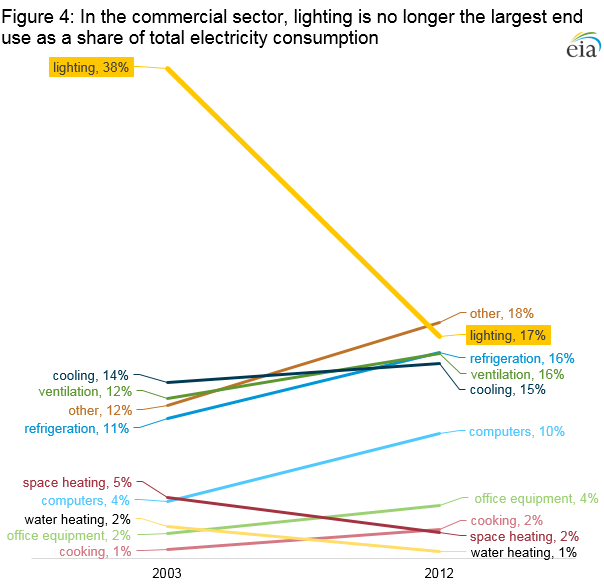
When considering just electricity usage in commercial buildings, lighting accounted for 17% of electricity consumption in commercial buildings in 2012 (Figure 4), down from 38% in 2003. However, lighting remains one of the largest end uses of electricity, second only to the broad category of other electricity end uses. The Other category of electricity uses includes miscellaneous electric loads (MELs), process equipment, motors, and air compressors.
Programs and policies that affect lighting
Increasing lighting efficiency has been a focus in many programs conducted by both governmental entities and electric utilities. At the federal level, two major pieces of legislation were passed between the 2003 and 2012 CBECS: the Energy Policy Act of 2005 (EPAct 2005) and the Energy Independence and Security Act (EISA) of 2007.
EPAct 2005 placed more stringent performance standards on some lighting types common in commercial buildings. It also created a temporary tax credit for energy efficient commercial buildings, which gave building owners an incentive to invest in new lighting types.
EISA increased the minimum efficiency standards for a broader range of bulb types. These standards required that new bulbs be about 25% more efficient starting in 2012. Incandescent bulbs could not meet these increased standards, but other bulb types did. EISA increases efficiency standards again in 2020, setting a threshold that neither incandescent bulbs nor halogen bulbs are expected to be able to meet, which could further the shift toward standard fluorescent, CFL, and particularly LED bulbs. Updates to building codes at the national, state, and local levels also served to promote more efficient forms of lighting. Future CBECS data collections will capture information about lighting installed under the new standards, but the change in the distribution of lighting types from 2003 suggests these policies have resulted in reduced lighting demand in commercial building spaces.
Operating separately from standards, the federal ENERGY STAR program certifies the efficiency of lightbulbs (and other products) and provides customers information about performance. ENERGY STAR also works with sponsors (often utilities and state agencies) of energy efficiency programs. These programs may include free or subsidized high-efficiency bulbs, education about energy efficiency, benchmarking data, and other services intended to help improve commercial building lighting efficiency. Compared with alternative investments in energy efficiency—such as upgrading heating, ventilation, and air conditioning (HVAC) systems or replacing insulation—lighting is an easy, accessible, and affordable change that building operators can make to reduce energy expenses. Therefore, energy efficiency programs are designed to encourage a shift toward more efficient forms of lighting, such as fluorescent and LED bulbs.
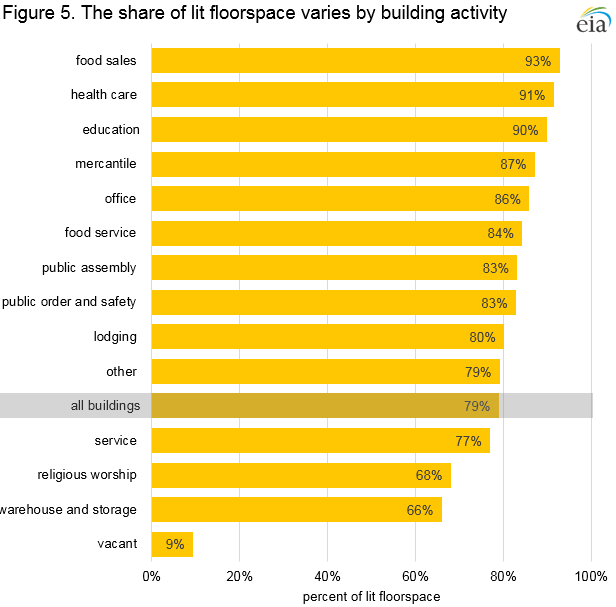
Lighting and principal building activity
Different activities demand different amounts of light within a building. The average amount of lit floorspace for all buildings is 79%, but three building types have light in at least 90% of the floorspace – food sales, health care, and education (Figure 5). Vacant, warehouse and storage, and religious worship buildings light less of their floorspace than other commercial buildings.
Commercial building lighting by bulb type
The following six charts show shares of floorspace lit by each type of bulb for the principal building activities. In each chart, the building activities are ordered from those with the most lit floorspace by bulb type to those with the least as determined by the 2012 CBECS. Where changes between the 2003 and 2012 were found to be statistically significant, they are noted in each section.3
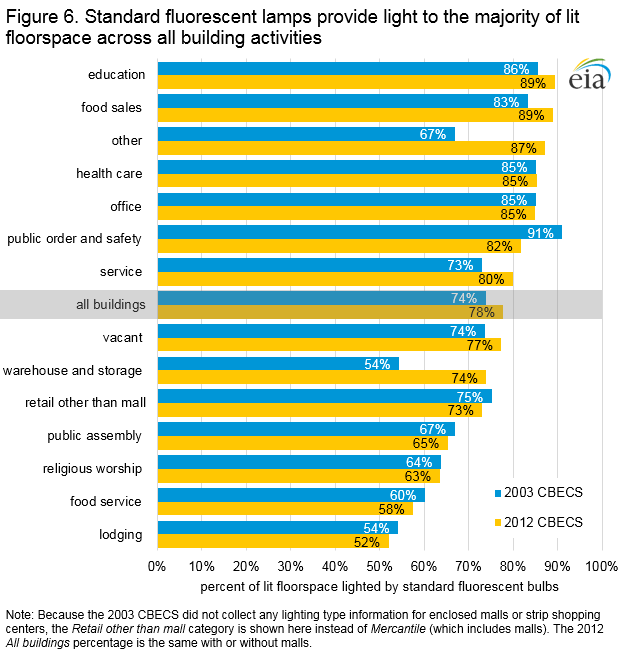
Standard fluorescent
Standard fluorescent bulbs provide light to the majority of lit floorspace across all building activities (Figure 6). Though this lighting type has been common in commercial buildings for decades, the technology continues to evolve. Tubes for standard fluorescents have become increasingly narrow in diameter, moving from T-12 lamps to T-8 and T-5, meaning that they can be made with higher quality materials, resulting in a more efficient bulb. Ballasts for standard fluorescent lights, the components that regulate electricity flow to the bulbs, have also improved. Electronic ballasts reduce flickering and noise and are more energy efficient than older magnetic ballasts. Given the prevalence of standard fluorescents in commercial buildings, these improvements in efficiency likely contributed greatly to the dramatic reductions in energy used for lighting in commercial buildings observed between 2003 and 2012.
- In 2012, standard fluorescent bulbs illuminated 78% of all lit floorspace. This level is not statistically different from 74% in 2003.
- Fluorescent lights illuminate 80% or more of lit floorspace for seven building types: education, food sales, other, health care, office, public order and safety, and service.
- None of the 14 building types examined here had statistically significant differences between 2003 and 2012 in the share of floorspace lit by standard fluorescent lights.
Compact fluorescent
The share of lit floorspace illuminated by compact fluorescent lighting increased by five percentage points from 2003 to 2012 (Figure 7).
- Lodging continues to be the most intense user of compact fluorescent bulbs, with 42% of lit floorspace lit by this type, nearly double the share (22%) in 2003.
- More than 10% of lit floorspace uses CFL bulbs in seven other principal building activity categories—food service, religious worship, public order and safety, public assembly, retail (other than mall), health care, and office.
- From 2003 to 2012, seven additional building types experienced a statistically significant increase in the share of lit floorspace lighted by CFLs: food service, religious worship, public order and safety, public assembly, office, service, and education.

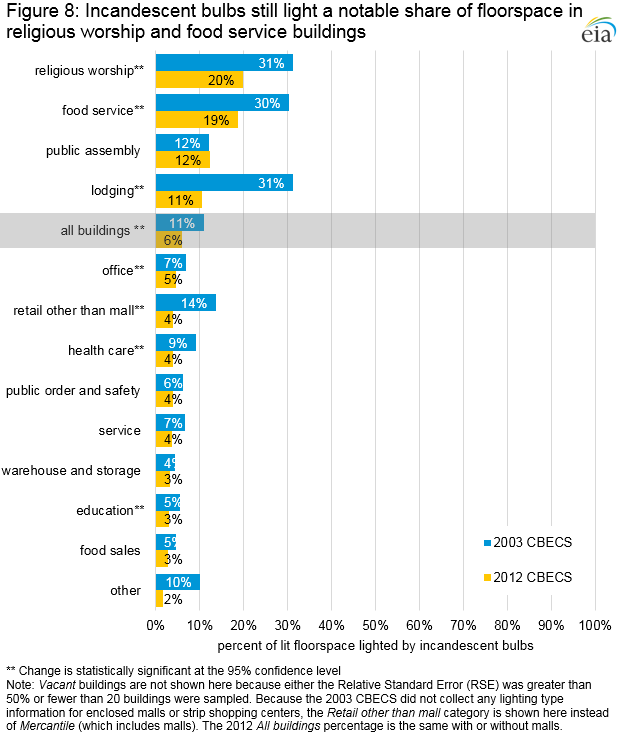
Incandescent
Higher governmental standards for lighting efficiency have decreased the availability of comparatively energy-intensive incandescent lighting. In 2003, 11% of lit floorspace in commercial buildings was lighted by incandescent lights; by 2012, only 6% of lit floorspace used the bulbs (Figure 8).
- As of 2012, incandescent bulbs light 20% or less of lit floorspace in all building activity categories.
- There was a statistically significant decrease in the share of lit floorspace using incandescent lamps in seven building categories between 2003 and 2012: education, lodging, food service, religious worship, retail (other than mall), health care, and office.
- Lodging showed the greatest decrease in incandescent use, with its share of lit floorspace lighted by the bulbs shrinking from 31% in 2003 to 11% in 2012. The simultaneous increase in the use of CFL bulbs by lodging buildings (from 22% to 42% of all lit floorspace) suggests that CFLs are replacing incandescent bulbs in lodging facilities.
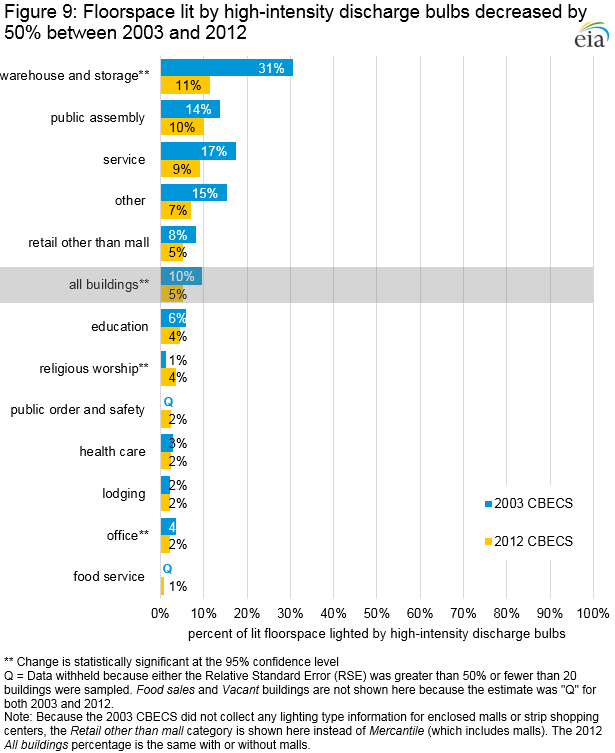
High-intensity discharge
High-intensity discharge (HID) lamps produce very bright light and are well-suited for illuminating large, open spaces. Compared with newer forms of lighting, such as LEDs, HID lamps are less efficient and are also harder to integrate into lighting control systems because they are difficult to dim and do not turn on instantly (Figure 9).
- The share of lit floorspace across all buildings lighted by HID lamps fell from 10% in 2003 to 5% in 2012.
- Warehouse and storage buildings are the most intense users of high-intensity discharge lighting, with 11% of lit floorspace illuminated with HID lights.
- Between 2003 and 2012 (where comparisons to 2003 are available), three building activities saw a statistically significant change in the percentage of floorspace lit by HID lights: office, religious worship, and warehouse and storage.
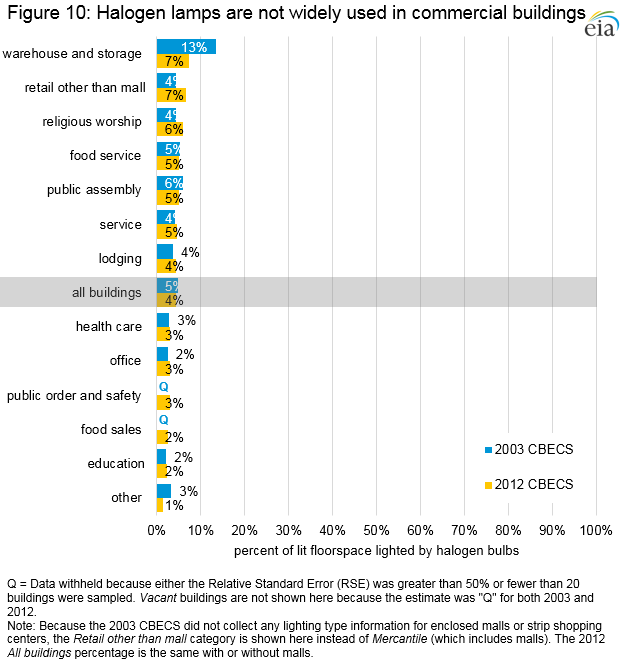
Halogen
Halogen lights are a type of incandescent bulb that contain halogen gas, which increases their efficiency. Halogen bulbs also have better color rendition, compared with other lighting types, producing light more similar to daylight. (Figure 10).
- Commercial buildings use very little halogen lighting; in 2012, only 4% of lit floorspace was illuminated by halogen lights.
- Halogen lights are most common in warehouse and storage buildings and in retail (other than mall) buildings, where they illuminate 7% of lit floorspace in each building category.
- No building type had a statistically significant change in the percent of lit floorspace illuminated with halogen lighting between 2003 and 2012.
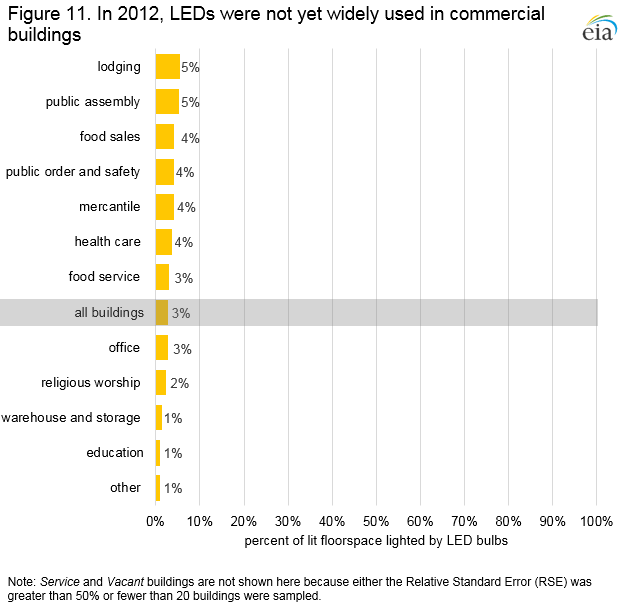
Light-emitting diode
Light-emitting diode lamps—more commonly known as LEDs—are a newer and highly-efficient type of lighting. LED technology is rapidly evolving, but these lamps were relatively new to the market as a conventional lighting type in 2012 (Figure 11).
- The 2012 CBECS was the first iteration of the survey to capture information on LED lighting.
- Overall penetration of LEDs was limited in 2012; only 3% of all lit floorspace was illuminated by LEDs.
- Lodging and public assembly buildings are the most intense users of LED lighting, with 5% of lit floorspace in each category using LEDs.
Lighting by building size
Smaller commercial buildings—those 50,000 square feet or less—account for 94% of all commercial buildings. However, they make up a disproportionately small amount of total commercial floorspace, slightly less than 50% of total floorspace.
The share of total site electricity used for lighting across all commercial buildings was 17% in 2012. The smallest category of buildings, those with 1,001 to 5,000 square feet, use the smallest share of electricity on lighting, at 13% (Figure 12). However, the percent of electricity consumed by lighting varies only slightly across the building size categories.
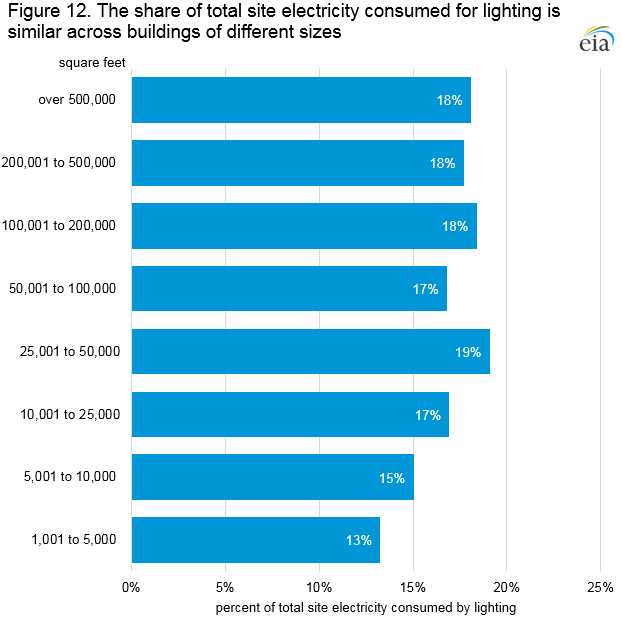
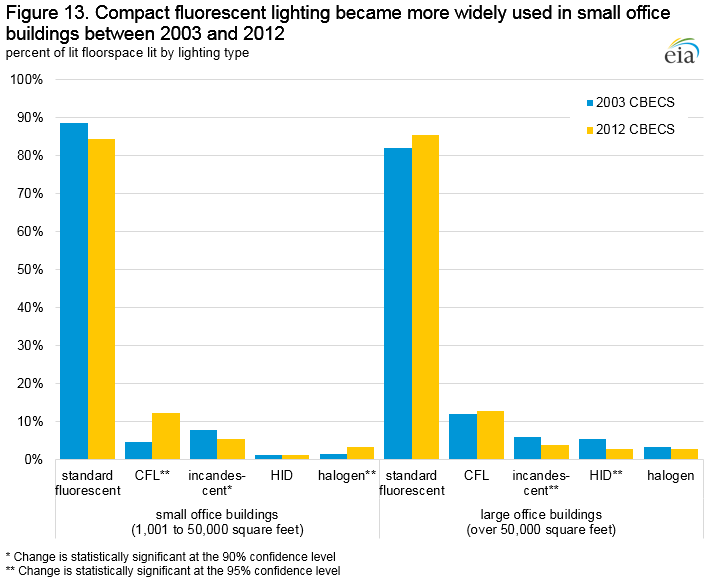
Office buildings make up the greatest proportion of total floorspace (18%) and total lit floorspace (20%) among commercial buildings.
- In 2012, small and large office buildings used standard fluorescent lighting to light most of their lit floorspace, with 84% and 85% of lit floorspace illuminated by standard fluorescents, respectively (Figure 13).
- From 2003 to 2012, there was a statistically significant decrease in the percentage of lit floorspace lighted by incandescent bulbs in small office buildings (from 8% to 5%) as well as in large office buildings (from 6% to 4%). Large office buildings also saw a decrease in the percentage of floorspace lit by high-intensity discharge lights (from 5% to 3%).
- Use of CFL bulbs had a statistically significant increase in small office buildings from 2003, when CFLs lit 5% of lit floorspace, to 2012, when CFLs lit 12% of lit floorspace. The use of halogen bulbs also grew in small office buildings, from 2% in 2003 to 3% in 2012.
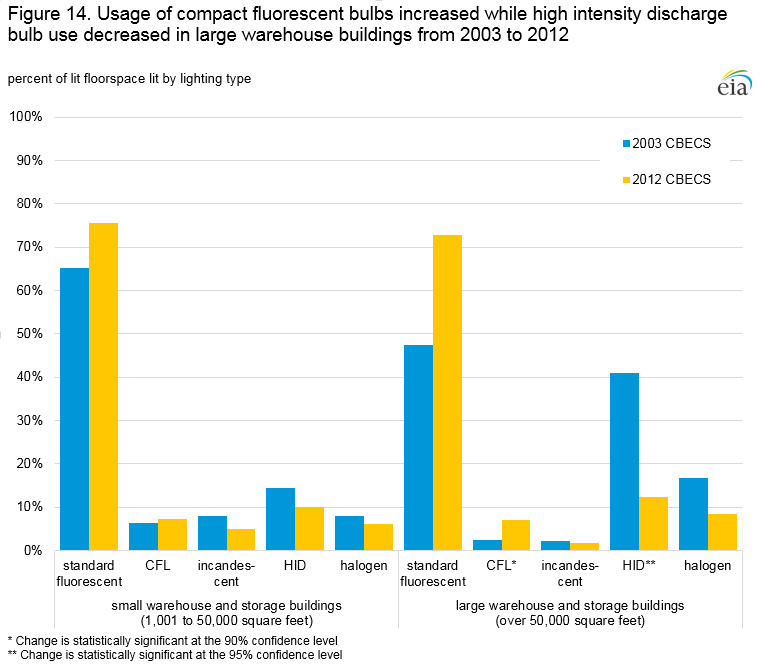
The use of lighting in warehouse and storage buildings was mostly unchanged between 2003 and 2012 (Figure 14).
- High-intensity discharge lamps illuminated 41% of lit floorspace in large warehouse buildings in 2003. By 2012, that share had dropped to 12%. Large warehouses also had an increase in the share of lighted floorspace lit by CFL bulbs (2% to 7%).
- No other lighting type had a statistically significant difference in the percentage of floorspace lit in warehouse buildings between 2003 and 2012. There is an apparent increase in standard fluorescent use in warehouses from 2003 to 2012 but it is not statistically significant.
Long-term trends in lighting in commercial buildings
The questions EIA asks about lighting within buildings have remained nearly identical in every CBECS since 1995, facilitating comparisons across the last four vintages of data.
- Standard fluorescent lighting has been present in more than 90% of commercial buildings across the four CBECS shown here (Figure 15 and Table 3).
- The share of buildings that use compact fluorescent lighting has risen sharply, from 9% of lit buildings in 1995 to 46% of lit buildings in 2012.
- The proportion of lit buildings using halogen lamps has also increased substantially since 1995.
- Fewer commercial buildings are using incandescent bulbs. The decrease was particularly notable from 2003 to 2012, when the share of lit commercial buildings using incandescent bulbs fell from 51% to 36% as new efficiency regulations came into effect.
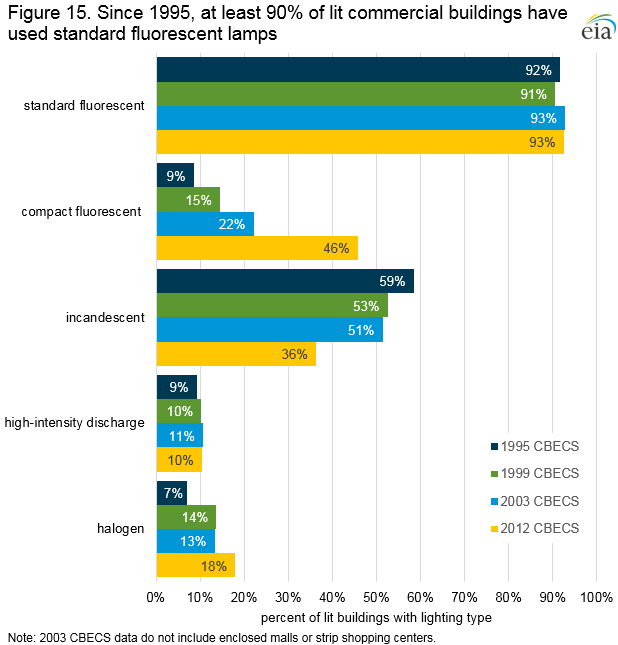
Table 3. Number of buildings by lighting type by year of survey
| Number of buildings (thousand) | |||||||
|---|---|---|---|---|---|---|---|
| Buildings lit by each type of light (more than one may apply) | |||||||
| Buildings with lighting | Standard fluores- cent |
Compact fluores- cent |
Incandes- cent |
High-intensity discharge | Halogen | LED | |
| Year of CBECS survey | |||||||
| 2012 | 5,025 | 4,649 | 2,302 | 1,826 | 525 | 905 | 473 |
| 20031 | 4,248 | 3,943 | 941 | 2,184 | 455 | 565 | NA |
| 1999 | 4,172 | 3,778 | 607 | 2,193 | 430 | 572 | NA |
| 1995 | 4,237 | 3,885 | 364 | 2,479 | 393 | 302 | NA |
| 1 Data are for non-mall buildings NA = Data for this category of lighting was not collected in the survey year. Source: U.S. Energy Information Administration, Commercial Buildings Energy Consumption Survey |
|||||||
- The share of floorspace lit by standard fluorescent lighting has remained relatively stable. (Figure 16 and Table 4).
- The proportion of lit floorspace illuminated by CFLs has increased while the share illuminated by incandescent lighting has gradually decreased. CFLs overtook incandescent lamps in 2012 to become the second most-used lighting type.
- From 1995 to 2012, halogen lighting was consistently used to light 5% or less of all lit floorspace in commercial buildings.
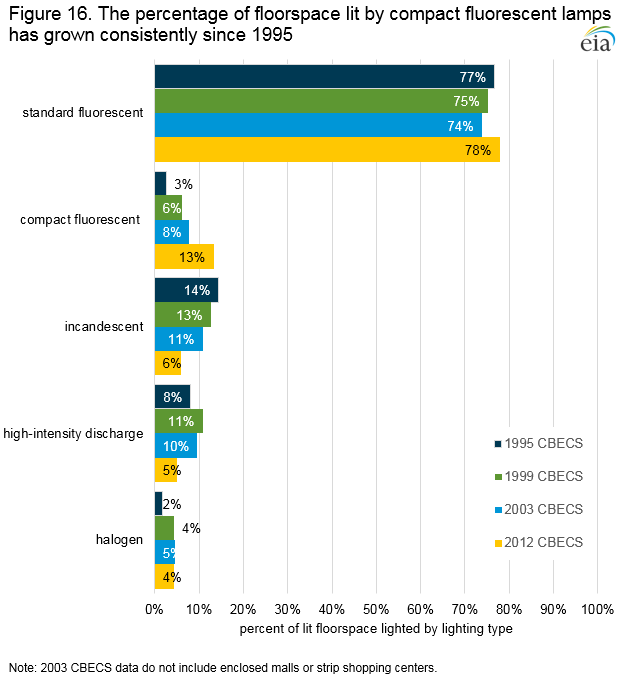
Table 4. Floorspace lit by lighting type by year of survey
| Floorspace lit by each type of light (million square feet) | |||||||
|---|---|---|---|---|---|---|---|
| Total lit floorspace (million square feet) | Standard fluores- cent |
Compact fluores- cent |
Incandes- cent |
High-intensity discharge | Halogen | LED | |
| Year of CBECS survey | |||||||
| 2012 | 68,729 | 53,490 | 9,113 | 4,071 | 3,527 | 2,973 | 1,957 |
| 20031 | 51,342 | 37,918 | 4,004 | 5,556 | 4,950 | 2,403 | NA |
| 1999 | 54,845 | 41,247 | 3,409 | 6,966 | 5,926 | 2,390 | NA |
| 1995 | 50,303 | 38,553 | 1,304 | 7,258 | 4,075 | 885 | NA |
| 1 Data are for non-mall buildings NA = Data for this category of lighting was not collected in the survey year. Source: U.S. Energy Information Administration, Commercial Buildings Energy Consumption Survey |
|||||||
Lighting controls and control strategies
The 2012 CBECS collected new information about lighting controls and lighting control strategies. These systems tend to be deployed in larger buildings.
- Occupancy sensors that reduce lighting when rooms are unoccupied: Sensors that automatically turn off or dim lights when a person leaves a room or space. Occupancy sensors were used in 16% of all lit buildings and 55% of large (more than 50,000 square feet) lit buildings.
- Scheduling: Lights are automatically dimmed or turned off at certain times of the day. Scheduling was used in 18% of all lit buildings and 43% of large lit buildings.
- Multi-level lighting or dimming: Control devices that adjust lighting power by continuous dimming, stepped dimming, or stepped switching. These devices were used in 7% of all lit buildings and 23% of large lit buildings.
- Building Automation System (BAS) controls the interior lighting system: BAS are most often used to control the mechanical, electrical, and plumbing systems in buildings, but they can also be used to provide lighting control based on an occupancy schedule. These systems were reported in 4% of all lit buildings and 19% of large lit buildings.
- Daylight harvesting: A lighting control and shade system that automatically dims light fixtures when natural light is available, and/or adjusts shades so that natural light and artificial light combine to provide the desired level of lighting. Daylight harvesting was used in 2% of all lit buildings and 9% of large lit buildings.
- Demand-responsive lighting: Reduces lighting by dimming or turning off lights at times of peak electricity pricing. This strategy was used in 4% of all lit buildings and 6% of large lit buildings.
- Plug-load control: Device that automatically turns off wall plugs and lights when a person leaves a room or space. Plug-load controls were reported in 1% of all lit buildings and 3% of large lit buildings.
- High-end trimming or light-level tuning: High-end trimming sets the maximum level of lighting to less than 100%. Light-level tuning sets the level even lower if a room or space needs less light. These strategies were used in 1% of all lit buildings and 1% of large lit buildings.
Footnotes
1 For more information on lighting technologies, efficacies, and expected lifetimes, see Appendices C and D of the U.S. Energy Information Administration’s Updated Buildings Sector Appliance and Equipment Costs and Efficiencies report, found at http://www.eia.gov/analysis/studies/buildings/equipcosts, and the U.S. Department of Energy’s Energy Saver lighting information pages at https://energy.gov/energysaver/lighting-choices-save-you-money.
2 Vehicle storage buildings are classified in the Service activity by CBECS.
3 For the text of this report, significance was tested at p<0.1.
Specific questions on this product may be directed to Consumption and efficiency data.


