Newer U.S. homes are 30% larger but consume about as much energy as older homes
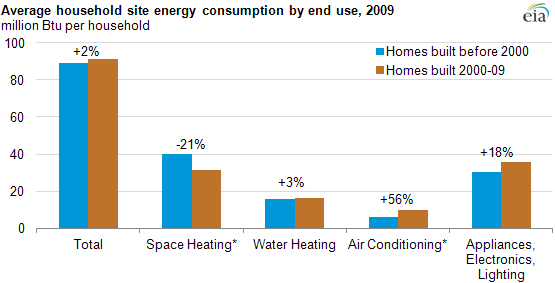
*Note: Averages for space heating and air conditioning reflect only those households that heated or cooled their homes in 2009.
Analysis from EIA's most recent Residential Energy Consumption Survey (RECS) shows that U.S. homes built in 2000 and later consume only 2% more energy on average than homes built prior to 2000, despite being on average 30% larger.
Homes built in the 2000s accounted for about 14% of all occupied housing units in 2009. These new homes consumed 21% less energy for space heating on average than older homes (see graph), which is mainly because of increased efficiency in the form of heating equipment and better building shells built to more demanding energy codes. Geography has played a role too. About 53% of newer homes are in the more temperate South, compared with only 35% of older homes.
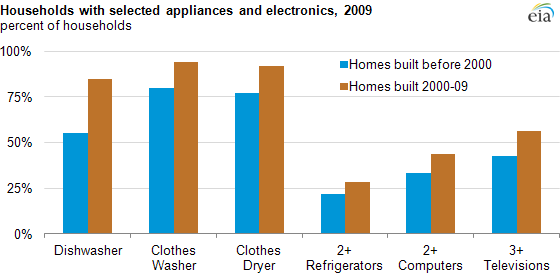
The increase in energy for air conditioning also reflects this population migration as well as higher use of central air conditioning and increased square footage. Similar to space heating, these gains were likely moderated by increases in efficiency of cooling equipment and improved building shells, but air conditioning was not the only end use that was higher in newer homes. RECS data show that newer homes were more likely than older homes to have dishwashers, clothes washers, clothes dryers, and two or more refrigerators. Newer homes, with their larger square footage, have more computers, TVs, and TV peripherals such as digital video recorders (DVRs) and video game systems. In total, newer homes consumed about 18% more energy on average in 2009 for appliances, electronics, and lighting than older homes.