Political risks focus attention on supply of Venezuelan oil to the United States
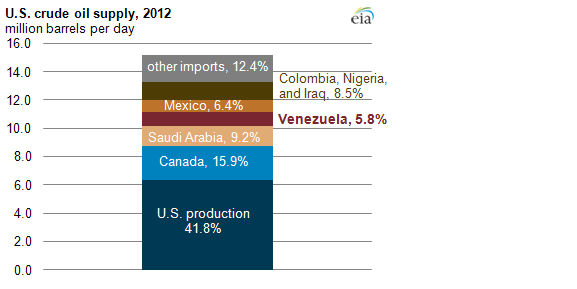
Uncertainty about the health of Hugo Chávez, Venezuela's president, has raised interest in understanding Venezuela's contribution to U.S. oil supply. Venezuela, a member of the Organization of the Petroleum Exporting Countries (OPEC), ranks among the 15 largest global oil producers and is the United States's fourth-largest source of imported oil, behind Canada, Saudi Arabia, and Mexico. Meanwhile, the United States, the world's largest oil consumer and oil importer, is the leading destination for Venezuelan oil exports.
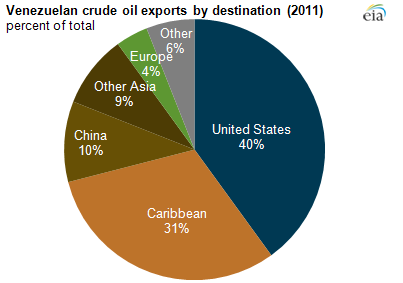
Venezuela and the United States (the U.S. Gulf Coast in particular) are naturally attractive oil-trading partners because of their geographic proximity and a lack of transit chokepoints between them. Furthermore, the robust trade in crude oil from Venezuela to the United States is due to the compatibility between the configuration of some U.S. refineries and the quality characteristics of Venezuelan crude, which is predominately sour (high sulfur content) and medium or heavy (lower degrees of API gravity, meaning it has a higher density). The U.S. Gulf Coast has a concentration of sophisticated refineries (including some wholly or partially owned by Citgo Petroleum Corp., a subsidiary of the Venezuelan national oil company) that can efficiently access and process Venezuelan oil. This partially explains why more than 95% of Venezuelan crude oil exports to the United States are directed to the U.S. Gulf Coast (PADD 3). Other significant export markets for Venezuelan crude include India, China, and various countries in Central America and the Caribbean, including some that receive oil through the preferential terms of the Petrocaribe initiative. EIA estimated that in 2011 Venezuela's total crude oil exports were 1.7 million bbl/d.
Note: Some crude oil shipped to the Caribbean may later have been shipped elsewhere.
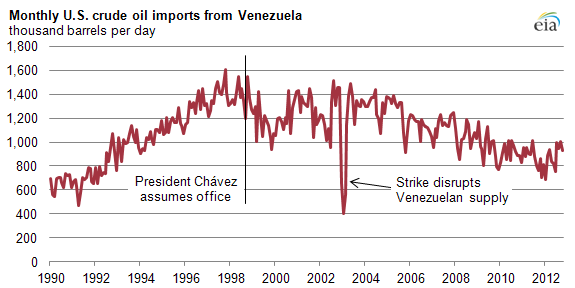
Although Venezuela remains an important source of crude for the United States, the volume of oil that the United States imports from Venezuela has declined over the past 15 years in conjunction with a more general decline in Venezuelan oil production.
U.S. imports of Venezuelan crude oil have fallen considerably since they peaked on an annual basis at 1.4 million bbl/d in 1997, when Venezuela was the largest supplier of foreign oil to the United States. Preliminary data for 2012 show that U.S. imports of Venezuelan crude averaged 879,000 bbl/d through October, or 5.8% of total U.S. crude oil supply.
U.S. imports of Venezuelan petroleum products also peaked in 1997, at 379,000 bbl/d, and have since fallen to as low as 23,000 bbl/d in October 2012. Meanwhile, U.S. exports of petroleum products to Venezuela, which heavily subsidizes liquid fuels, surged to an all-time high of 196,000 bbl/d in September 2012 following an explosion at Venezuela's largest oil refinery.
A number of important political developments have occurred in Venezuela since its oil exports to the United States peaked in 1997. President Chávez took office in 1999 and has enacted various policies to increase state control over the oil industry through the national oil company, Petróleos de Venezuela (PDVSA). A general strike that began in December 2002 initially disrupted two-thirds of Venezuela's 3.0 million bbl/d of production, a level to which Venezuela's production has yet to fully return. EIA estimated that Venezuela produced 2.2 million bbl/d of crude oil in 2012, although definitive numbers are unavailable. Adding lease condensate, natural gas liquids, and refinery processing gains, total Venezuelan oil production was approximately 2.5 million bbl/d in 2012.