EIA publishes historical data series on natural gas storage in salt caverns
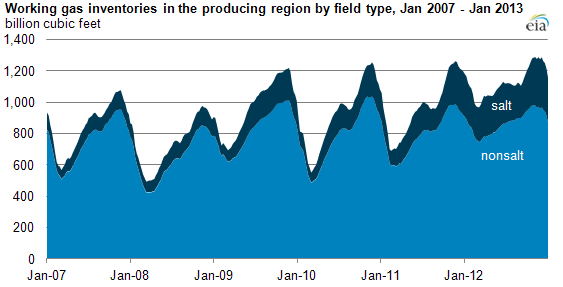
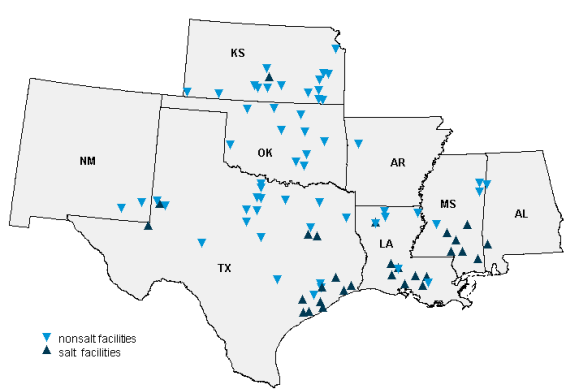
In the January 17, 2013 Weekly Natural Gas Storage Report, EIA published historical data back to 2007 showing the breakout of working gas storage in salt caverns versus other types of storage facilities in the Producing Region (Texas, Louisiana, Oklahoma, New Mexico, Arkansas, Alabama, Mississippi, and Kansas). Unlike other types of storage facilities, salt cavern storage is capable of rapid cycling and can be filled and drawn many times over the course of a year. For this reason, data regarding salt cavern storage is of particular interest to analysts and industry participants who follow natural gas markets.
The Producing Region (which accounted for nearly 70% of 2011 U.S. marketed natural gas production, when including the Gulf of Mexico production volumes) has seen considerable growth in working gas capacities and inventories since 2007. This growth in working gas storage in the region has been driven mainly by continued growth at salt dome facilities. As a result, natural gas storage in salt dome facilities has driven the record-high levels of working gas established in the Producing Region in five of the last six years. Salt dome facilities in the Producing Region posted new 5-year (2008-12) maximum levels during each week of 2012 and exceeded this upper band in the first weeks of 2013.
In contrast, working gas levels at nonsalt facilities, which are predominately depleted fields, also hit new seasonal peaks between December 2011 and July 2012. However, these peaks were achieved not by growth at these facilities, but rather by a much slower-than-average rate of withdrawal at these facilities during the 2011-12 heating season. A slower-than-average rate of net injections through most of the 2012 refill season brought working gas levels at these facilities back into the 5-year (2008-12) range.
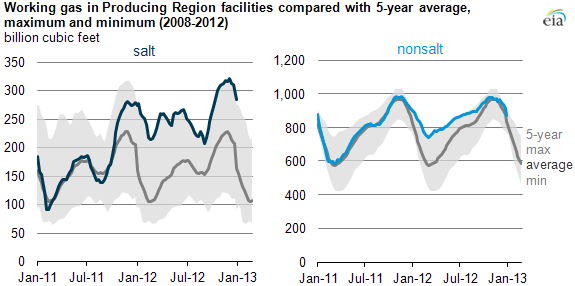
Salt dome natural gas storage facilities are known for their high deliverability (i.e., the rate at which natural gas can be withdrawn or delivered from a storage facility). As a result of their higher deliverability, salt dome natural gas storage facilities are capable of cycling their inventories several times a year—much faster than the capabilities of traditional nonsalt natural gas storage facilities. The weekly historical inventory data for salt dome storage being released today offer a glimpse of this rapid deliverability, showing the greater weekly variability of working gas levels in salt dome facilities compared to that in nonsalt facilities in the Producing Region.
Seasonal patterns can differ somewhat between salt and nonsalt facilities, because working gas levels in salt dome facilities can be more variable than at other facilities. For example, during the injection season of 2011, inventories at salt facilities declined to 139 billion cubic feet (Bcf) by August 26, as natural gas was withdrawn from those facilities to serve increased natural gas use by electricity generators to supply additional power to meet air-conditioning needs. However, within several weeks, stocks at these facilities had more than doubled, reaching 281 Bcf in December, demonstrating their rapid injection capabilities.
Additional Changes and New Data Access Option
In addition to the new historical data, EIA is updating the entire webpage, reformatting the summary table to reflect the new breakout, and providing a new data-access option—JavaScript Object Notation (JSON)—that is much better for machine-to-machine data exchange. Much of the traffic to the Weekly Natural Gas Storage Report is robotic, and JSON allows easier access to the data. The web address, existing filenames, and EIA's Gatekeeper delivery methodology will remain the same.
Tags: inventories/stocks, map, natural gas, production/supply, storage