2012 Brief: Coal and mid-continent crude oil prices declined during 2012
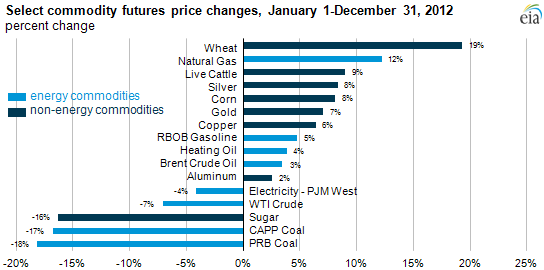
Note: Price changes are derived by taking the difference in prompt contract price for each commodity between January 1 and December 31, 2012. This method allows for comparisons of different commodity classes on a consistent basis. PRB Coal is Powder River Basin Coal. CAPP Coal is Central Appalachia Coal. WTI is West Texas Intermediate, a benchmark for both physical and financial crude oil pricing located in Cushing, Oklahoma. RBOB Gasoline is a kind of gasoline based on a reformulated blendstock for oxygenate blending (RBOB).
This article continues a series of briefs on energy market trends in 2012.
Coal and mid-continent crude oil (WTI) led energy commodity price declines in 2012. Natural gas was the only key energy commodity with a significant price increase when comparing January 1 to December 31. Heating oil, Brent crude oil, and wholesale gasoline (RBOB) ended 2012 close to the level at which they started the year.
In 2012, average prices for crude oil and petroleum products were largely close to the 2011 averages, with some fluctuations throughout the year. Natural gas prices declined through the early portion of 2012 but then increased in the early fall and winter. Prices for Central Appalachian (CAPP) and Powder River Basin (PRB) coal declined at the beginning of 2012 and remained significantly below the average levels of 2011.
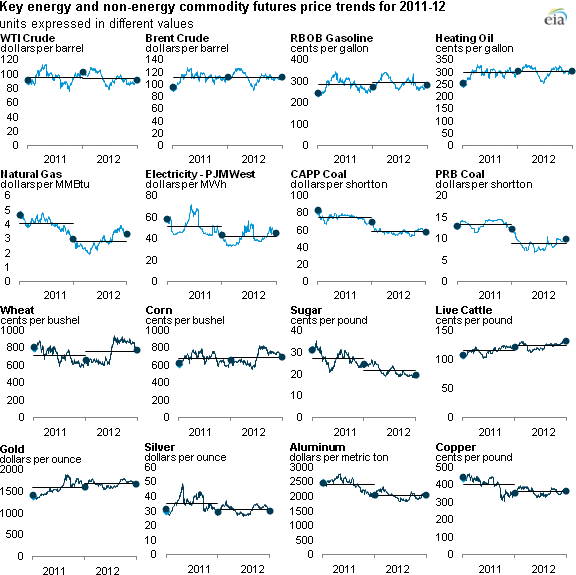
Note: Horizontal lines represent annual average prices, dots represent annual end points. All data are near-month futures contracts. Commodity choices were based loosely on the Goldman Sachs Commodity Price Index and adjusted for greater coverage of energy commodity trends.
During the next few days, Today in Energy articles will focus on key energy commodity price trends in 2012. Today's overview uses near-month contract or futures prices to ensure comparability across commodities; most other articles in this series will focus on spot market trends. Key findings from the forthcoming articles include:
Crude oil and petroleum products
- Brent crude oil averaged $111.67 per barrel in 2012, edging past last year's average price of $111.26 per barrel and marking the second year in a row that the global oil benchmark averaged more than $100 per barrel.
- West Texas Intermediate crude oil averaged $94.05 per barrel in 2012, down slightly from $94.88 in 2011.
- The annual average price gap between Brent and WTI reached $17.61 per barrel, up from 2011's level of $16.38.
- The national weekly average pump prices for gasoline and diesel fuel during 2012 set record highs of $3.62 and $3.97 per gallon, respectively, and marked the second year in a row that the average price for either transportation fuel failed to drop below $3 per gallon during any week.
Natural Gas
- Average, spot natural gas prices were lower compared to 2011, however both futures and spot prices increased in the latter half of the year.
- Natural gas prices were generally uniform across the country, except when residential and commercial demand peaked during the colder winter months. During these periods, pipeline constraints into the Northeastern United States led to increased separation of the average natural gas wholesale (spot) prices at major hubs in New England and New York above the average spot price at Henry Hub.
Electricity
- Average, spot, on-peak wholesale electricity prices were lower across the United States and largely followed the trend in natural gas prices.
- Several short-term price spikes occurred during the summer months in several U.S. regions as electric demand increased to meet summer air-conditioning load.
Coal
- Wholesale (spot) coal prices across all basins fell during the first half of 2012, with steep declines in Powder River Basin (PRB) and Eastern basins, before stabilizing in the latter half of the year.
- Record exports of both thermal and metallurgical coal helped offset declines in consumption in the power sector.