
Despite customer outages, wholesale electric markets operated during Hurricane Sandy
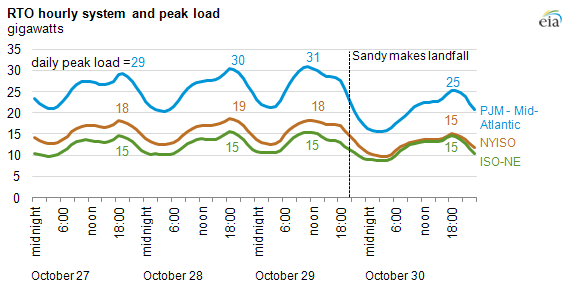
Note: PJM load includes only Mid-Atlantic region.
Despite causing more than eight million customers to lose power, Hurricane Sandy had only a small effect on wholesale electricity markets. Disruptions to electricity demand in the wake of the storm partially offset the temporary loss of supply, limiting wholesale price increases. Although supply and demand imbalances can result in significant price effects, power markets remained relatively orderly despite the stress from the storm. This was shown by the continued operation of the regional transmission organizations, which manage the transmission grid and the wholesale electricity markets across the Northeast.
Demand for electricity in PJM, ISO-New England and the New York ISO (the regional transmission organizations that serve the Mid-Atlantic and Northeastern regions) fell 18%, 5%, and 17%, respectively, between October 29 and 30, after Hurricane Sandy made landfall on October 29. This was largely due to extensive retail customer outages in the region; however, trading in the wholesale electricity markets continued throughout the disruption.
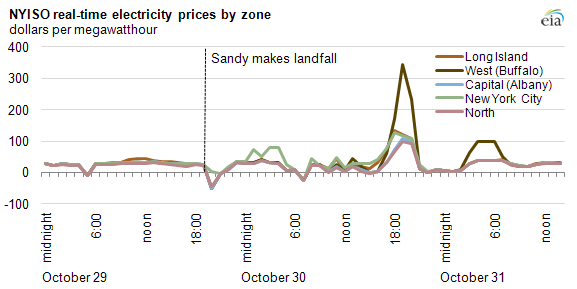
Short-term spikes in the real-time electricity markets similar to previous supply disruptions occurred, however the day-ahead prices remained relatively stable. The immediate drop in real-time prices (see chart above) in New York ISO after Sandy made landfall indicate oversupply on the system. Short-term spikes in electricity hubs in Western New York occurred at peak load the next day as generation sources in New York City and other eastern portions of the system remained offline, increasing demand from sources in the west. Real-time prices in ISO-New England were stable in the days after Hurricane Sandy's landfall. In PJM, real-time markets operated though the RTO did declare a Minimum Generation Event, a signal that the dispatcher could not match decreasing load and emergency reducible generation was necessary. Overall the bulk-transmission system continued to operate, despite loss of some transmission lines and substations.
Day-ahead, on-peak power prices in the region continued to range between $30 and $55 per megawatthour in the days after the storm. Recent cold weather has increased day-ahead prices across the Northeast above levels seen after the landfall of Hurricane Sandy.
Several nuclear power plants were shut down or reduced output due to damage to transmission lines, concerns over storm surge, and other severe-weather precautions. Substations and other key electricity supply infrastructure were also damaged in the storm.