
Trading Point: Central Appalachian (CAPP) is the nation's benchmark price for eastern coal
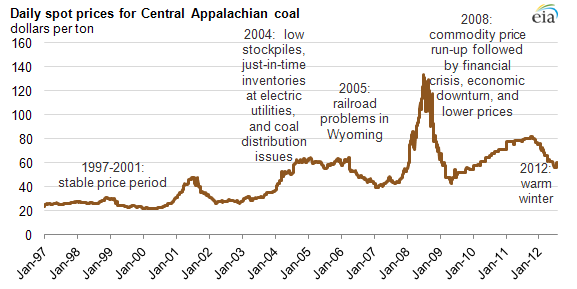
Central Appalachian (CAPP) coal spot prices are the most widely referenced prices for eastern coal in the United States. Coal producers, electric utilities, merchant generators, non-utility industrial coal users, and other energy marketers use CAPP spot prices as a benchmark in both physical and financial transactions for short-term and long-term contracts. Changes in CAPP spot prices can affect fuel procurement and power dispatch decisions. EIA's Coal News and Markets report provides weekly updates on U.S. benchmark spot coal prices, including CAPP.
This is the first of two articles on Central Appalachian coal as a key benchmark (or trading point) in the U.S. energy sector. A second article will run tomorrow dealing with the importance of CAPP spot prices on futures prices, fuel procurement, and electric power dispatch decisions in the U.S. energy sector.
Why CAPP?
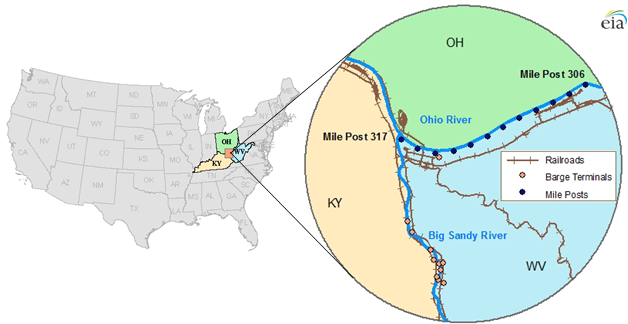
The Central Appalachian Delivery Zone is a major trading center for Central Appalachian coal that acts as a delivery point for coal that is bought and sold under spot and futures contracts. This Zone includes points on the Ohio River between mile posts 306 and 317, and points along the Big Sandy River. The presence of many potential sellers and buyers makes the CAPP Delivery Zone a natural center for market activities. In the CAPP Delivery Zone, coal from eastern Kentucky, southern West Virginia, Tennessee, and Virginia arrives from many producing mines, typically by train or truck. The coal is then reshipped in large lots by multi-car or unit trains and barges to many final customers, namely coal-fired electric generating plants, industrial plants, commercial and institutional facilities, and coke plants.
What's included in the spot price?
CAPP spot prices reflect the value of Central Appalachian coal in the CAPP Delivery Zone location. They reflect all costs incurred within the Zone, including transportation from the mine. CAPP spot prices do not reflect these costs:
- Transportation costs to deliver coal from the delivery zone to a power plant or other facility
- Any emission abatement costs
- Other handling charges
What trading actually takes place in the CAPP Delivery Zone?
The volume of CAPP Delivery Zone trading is low compared to volumes traded in oil and natural gas spot markets. In a typical day, CAPP brokers may complete 10 to 30 barge and/or train contracts. Most are for physical deliveries. Only a few are conventional financial trades, either for future delivery or swaps against previous futures contracts. In 2011, the total trading volume for Nymex coal futures contracts was less than 1% of the total trading volume for either Nymex natural gas futures contracts at Henry Hub or Nymex West Texas Intermediate crude oil futures contracts, according to CME Group data. Tomorrow's article will discuss the impact of spot prices on these contracts in further detail.
Tags: coal, emissions, map, marine transportation, mining, Ohio, prices, rail, states, West Virginia