
Projected Alaska North Slope oil production at risk beyond 2025 if oil prices drop sharply
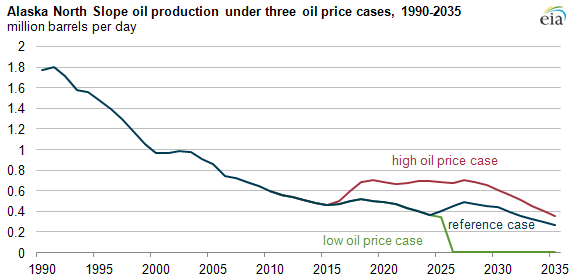
Oil production on Alaska's North Slope, which has been declining since 1988 when average annual production peaked at 2.0 million barrels per day, is transported to market through the TransAlaska Pipeline System (TAPS). Because TAPS needs to maintain throughput above a minimum threshold level to remain operational, its projected lifetime depends on continued investment in North Slope oil production that itself depends on future oil prices. In the Annual Energy Outlook 2012 low oil price case, North Slope production would cease and TAPS would be decommissioned, which could occur as early as 2026.
The 48-inch diameter, 800-mile long TAPS crude oil pipeline transports North Slope crude oil south to the Valdez Marine Terminal, where the oil is then shipped by tankers to West Coast refineries. TAPS is currently the only means for transporting North Slope crude oil to refineries and the petroleum consumption markets they serve.
Low flow rates on crude oil pipelines can cause operational issues, particularly in the frigid Arctic. On June 15, 2011, the TAPS operator—Alyeska Pipeline Service Company—released the TAPS Low Flow Impact Study that identified the following problems that might occur as North Slope oil production progressively declines below 600,000 bbl/d, thereby resulting in declining TAPS throughput:
- Potential water dropout from the crude oil, which could cause pipeline corrosion
- Potential ice formation in the pipe if the oil temperature were to drop below freezing
- Potential wax precipitation and deposition
- Potential displacement of the buried pipeline due to soil freezing and thawing, as pipeline operating temperatures decline
Other potential operational issues at low flow rates include: sludge drop-out, reduced ability to remove wax, reduction in pipeline leak detection efficiency, pipeline shutdown and restart, and the running of pipeline pigs that both clean and check pipeline integrity.
The severity of potential TAPS operational problems is expected to increase as throughput declines; the onset of TAPS low flow problems could begin around 550,000 bbl/d, absent any mitigation. As the types and severity of problems multiplies, the investment required to mitigate those problems is expected to increase significantly. Because of the many and diverse operational problems expected to occur below 350,000 bbl/d, considerable investment might be required to keep the pipeline operational below this throughput level.
Analysis of Alaskan production in the Annual Energy Outlook 2012 (AEO2012) assumed that the North Slope oil fields would be shutdown, plugged, and abandoned and TAPS would be decommissioned, when two conditions were simultaneously satisfied: 1) TAPS throughput was at or below 350,000 bbl/d and 2) total North Slope oil production revenues were at or below $5.0 billion per year. These conditions are satisfied only in the AEO2012 low oil price case, when North Slope oil production is shutdown and TAPS is decommissioned in 2026.