Drought has significant effect on corn crop condition, projected ethanol production
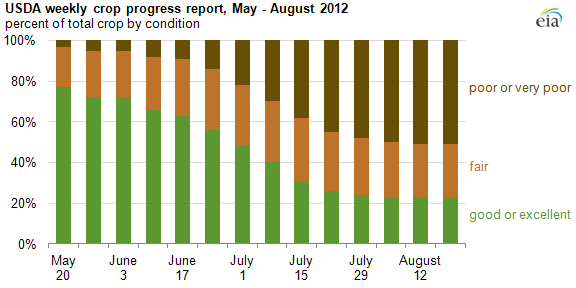
The U.S. Department of Agriculture (USDA) has reported a significant rise in the proportion of poor and very poor corn crops this summer, due largely to the extreme drought across much of the center of the nation. The corn crop in the affected region is a main feedstock for ethanol, which is blended into gasoline.
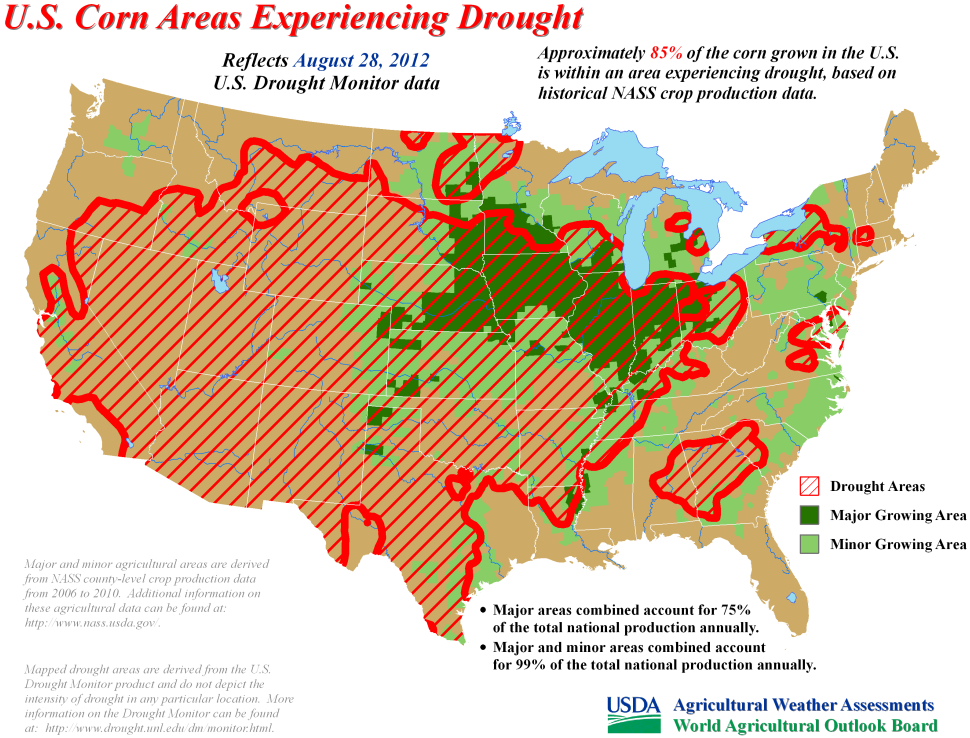
The U.S. Drought Monitor, a joint publication of USDA and the National Oceanic and Atmospheric Administration (NOAA), is currently reporting that large areas of the Midwest and Great Plains regions, which are substantial corn-producing areas, are experiencing significant drought conditions. Analyzing Drought Monitor data, the USDA's Agricultural Weather and Drought Update for August 16 reported that 85% of the U.S. corn crop is located within a drought area, with nearly half of the crop area experiencing extreme or exceptional drought levels, their most severe designations. The map below illustrates the location of U.S. drought areas superimposed on major and minor corn-growing areas.
Three major types of corn are grown in the United States. Field corn, which is grown for animal feed, ethanol, and processed corn products (such as food-grade corn oil and corn syrup) typically makes up about 98% of the acreage of corn grown each year. Sweet corn and popcorn, both used mainly as food, make up the rest of the corn crop.
For the 2010-2011 harvest season, out of a total supply of 14.2 billion bushels of field corn, 33.8% was used for livestock feed and other residual uses (including feed for horses and household pets), 45.3% was used for food, seed and industrial processes, 35.4% was converted to ethanol, and 12.9% was exported. The ethanol industry provides dried distillers' grains (DDGs), a valuable by-product that is fed to livestock alone or in combination with regular corn feed. When ethanol production increases, the supply of DDGs also increases.
The USDA's Feed Outlook for June 2012 reported that 66% of the nation's corn crop was rated as good or excellent as of June 10. Farmers took advantage of the relatively warm winter and planted corn early, looking toward a record harvest projected at 14.8 billion bushels. However, the July Feed Outlook reported that the total projected corn harvest fell to 13.0 billion bushels due to drought, 12% less than expected. By the end of July, the portion of the U.S. corn crop rated good or excellent had fallen to 26%. The August Feed Outlook now projects the total U.S. corn harvest to be 10.8 billion bushels; the proportion of the crop rated as good to excellent is 23%.
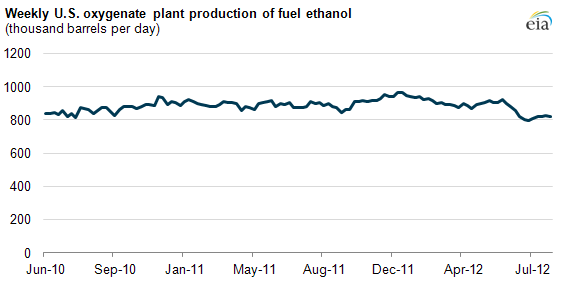
The drought conditions have reduced expectations for the amount of corn that will be harvested in 2012. Ethanol producers may already be cutting back production, as July was the lowest month for ethanol production in the last two years. Ethanol production fell from 920 thousand barrels per day (bbl/d) for the week ending June 8, 2012 to 809 thousand bbl/d for the week ending July 27, 2012.
In the August 2012 Short-Term Energy Outlook, EIA reduced its 2012 ethanol production forecast from 900 thousand bbl/d (13.8 billion gallons per day) to 870 thousand bbl/d (13.3 billion gallons), with production in the second half of 2012 now projected to average 833 thousand bbl/d (12.8 billion gallons). EIA expects ethanol production to recover in the second half of 2013, averaging about 880 thousand bbl/d for the year.
Beginning in late June 2012, ethanol prices rapidly increased after several months of relative stability. Near-month ethanol futures prices rose from around $2.10 per gallon in late June to a year-to-date high of $2.70 per gallon on July 25 and have since fallen to $2.59 per gallon as of August 28. Analysis conducted for the Short-Term Energy Outlook's Price Uncertainty Report indicates that, as of the end of July, there had been no discernible pass-through pressure on retail gasoline prices from the increase in ethanol prices.
Tomorrow's article will focus on drought-based price impacts on corn, ethanol, and gasoline markets.
Tags: biofuels, biomass, ethanol, liquid fuels, map, prices, production/supply, renewables, weather