Hurricane Isaac affects U.S. Gulf Coast energy infrastructure
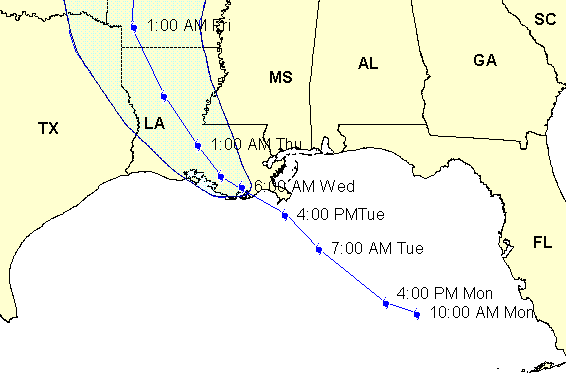
Hurricane Isaac is a category one hurricane, significantly less severe than Hurricanes Katrina, Rita, Gustav, and Ike in 2005 and 2008, but it has affected Gulf Coast energy infrastructure. The slow-moving but large hurricane with sustained winds of 80 miles per hour made landfall at 6:45 p.m. Central Time Tuesday along the coastline of southern Louisiana. Federal emergency officials believe that these characteristics of the storm suggest that flooding from rainfall is likely to pose larger risks than wind.
The National Oceanic and Atmospheric Administration (NOAA) predicted a near-normal Atlantic hurricane season this year.
Physical Market Effects
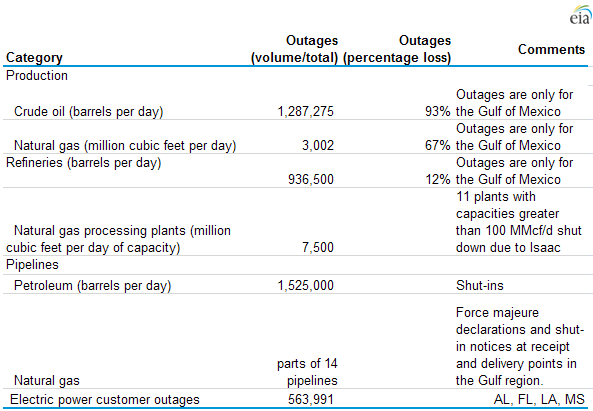
Issac is the first major Atlantic hurricane of 2012 to affect the U.S. energy infrastructure. As of Tuesday, August 28, about 1.3 million barrels per day of crude oil production are shut-in, and about 3 billion cubic feet per day of Gulf natural gas production are shut-in according to the Bureau of Safety and Environmental Enforcement. Five refineries are shut down and four crude oil pipelines are shut-in due to weather conditions. More than a dozen natural gas pipelines have temporarily curtailed receipts and/or deliveries of natural gas (mainly due to force majeure declarations) and a number of processing plants have shut down.
According to the latest (10:00 a.m. Wednesday) Situation Report from the U.S. Department of Energy, about 564,000 customers were without power in Alabama, Florida, Louisiana, and Mississippi. Approximately 95% of the current customer outages are in Louisiana, many in electric utility Entergy's territory. The Nuclear Regulatory Commission (NRC) reported that Entergy's Waterford number 3 reactor temporarily shut down due to concerns about the storm, however, the remaining nuclear power plants in the region were operational.
Physical energy market summary
Key wholesale prices since last Friday are provided in the table below.
Energy market spot price summary
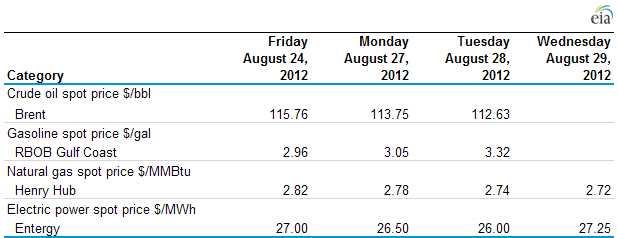
Note: Electric prices for on-peak period only.
Tags: crude oil, electricity, Gulf Coast, map, natural gas, pipelines, prices, production/supply, refining, weather