
Marcellus natural gas production gains affect spreads between trading points
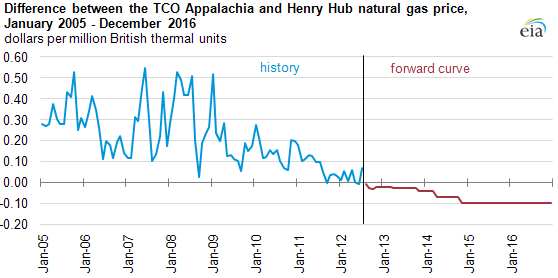
Note: The blue series shows the historical difference between the monthly average spot natural gas price at the Columbia Appalachia (TCO Appalachia) trading point and the Henry Hub trading point. The red series reflects the "forward curve" or slate of monthly values for the TCO Appalachia CME Group NYMEX ClearPort basis swap as of July 19, 2012. This basis swap is a financial instrument representing the difference in the value between natural gas in southwest Pennsylvania and the natural gas futures contract at the Henry Hub in the Gulf Coast for the period July 2012 through December 2016. This series reflects how some market participants assess the future difference between the southwest Pennsylvania and Gulf Coast natural gas market.
Spreads between the Columbia Gas Transmission Corp. Appalachian index (TCO Appalachia)—an actively traded location for both physical and financial transactions for natural gas in southwest Pennsylvania—and the Henry Hub in the U.S. Gulf Coast are changing due mainly to growth in Marcellus production. Natural gas at the TCO Appalachia index has historically been priced about $0.25 per million British thermal units (MMBtu) above Henry Hub. However, the spread between these two points in spot markets reflects rough parity now, and in forward markets TCO is priced less than at the Henry Hub.
The natural gas price spread between TCO Appalachia and Henry Hub has been evolving. The monthly average spread, based on spot prices, ranged from $0.23-0.33/MMBtu during 2005-2008 and averaged $0.19/MMBtu in 2009, $0.15/MMBtu in 2010, and just $0.08/MMBtu in 2011. Through the first half of 2012, the TCO minus Henry Hub spread averaged just $0.02/MMBtu. In June 2012, spot gas priced at the TCO Appalachia index was lower than Henry Hub natural gas. As of early July, forward prices indicates that the TCO Appalachia basis swap is priced lower than the Henry Hub futures contract through the end of 2016, mostly reflecting the growth in Marcellus natural gas production.
Rising production in the Marcellus basin is influencing the U.S. natural gas market in numerous ways, including:
- Changing Northeast price levels and differentials
- Reducing the need for Canadian natural gas imports
- Altering regional natural gas flow patterns
- Boosting requirements for more take-away pipeline capacity related to Marcellus production
- Expanding natural gas processing infrastructure needs
- Supporting increased use of natural gas for power generators
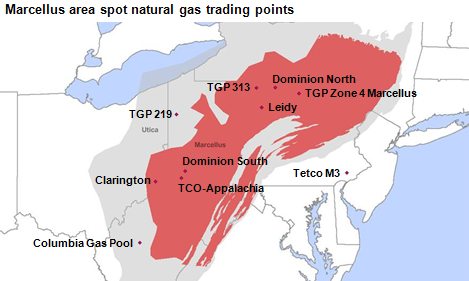
Note: The red zone represents Marcellus, and the grey zone represents Utica.
Tags: map, Marcellus, natural gas, prices, production/supply, shale, wholesale prices