Eastern electric systems tested during first summer 2012 heat wave
In a fairly typical summer weather pattern, high temperatures moved out of the Midwest into the population centers of the Mid-Atlantic and Northeast regions during June 19-22, 2012. Heat waves like this one drive up air conditioner use and electricity demand. Electric systems are designed to maintain electric supply under these conditions.
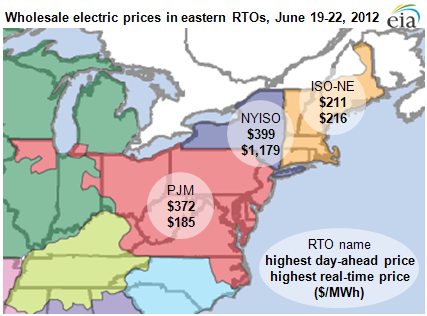
Extensive operating and market information available on Regional Transmission Organizations' (RTOs) websites lets market participants track the effects of the heat wave in real-time and examine in more detail after the fact. The three RTOs in the Mid-Atlantic and Northeast are the PJM Interconnection (PJM), the New York Independent System Operator (NYISO), and the New England ISO (ISO-NE). The publicly available operating and price information provides a fairly detailed picture of the level of electric system stress during heat waves.
Forecast and Actual System Demand: Electric systems use weather forecasts and other information to forecast electricity demand. Some RTOs post their hourly demand forecasts for up to the next seven days. This information provides earlier notice of upcoming heat wave-related system events. RTOs also post their actual hourly demand soon after the end of the hour. This allows monitoring whether actual demand is growing more quickly or more slowly than expected during the day. System forecast demand, actual demand, and all-time record peak hour demand are shown below for the June heat wave in the first tab of the charts for PJM, NYISO and ISO-NE.
Day-Ahead Prices: High RTO hourly day-ahead prices are another indicator of potential electric system stress. Electric systems typically commit generating units the day ahead to be available for the next day. Six of seven U.S. RTOs do this by optimizing bids submitted by generators and load-serving entities to produce hourly prices at hundreds or thousands of pricing locations on their system, known as locational marginal pricing (LMP). (In the Southwest Power Pool RTO, member systems perform this unit commitment function.)
With LMP, prices may be different at different locations. Price differences reflect transmission congestion—or the inability to deliver lower cost power to certain places on the system. Price differences may also indicate a potential inability to deliver needed supply. These prices reflect modeled system conditions based on supply and demand bids and the operating status of grid elements. These unit commitment-related prices are available in the afternoon of the day before. These "day-ahead" LMPs are shown below for the June heat wave in the second tab of the charts for PJM, NYISO and ISO-NE.
Real-Time Prices: An indicator of actual system stress on the electric grid is high and rapidly changing RTO five-minute real-time prices. System operators must maintain a balance of supply and demand continuously. As demand rises and then falls over a day, operators bring on and take off committed generators to match demand. System conditions rarely match the model results from the day before, so the RTO runs an optimization every five minutes to handle needed adjustments. This model produces real-time LMPs.
High or low (even negative) prices can indicate an imbalance between supply and demand. A price spike over the five-minute interval, up or down, may indicate a short-lived imbalance due to generator outages or transmission congestion or outages. A sustained high real-time price indicates a supply shortfall. Locational differences in real-time LMPs indicate transmission congestion and, during a supply emergency, an inability to deliver supply to certain locations. These "real-time" LMPs are shown below for the June heat wave in the third tab of the charts for PJM, NYISO and ISO-NE.
PJM Interconnection (PJM)
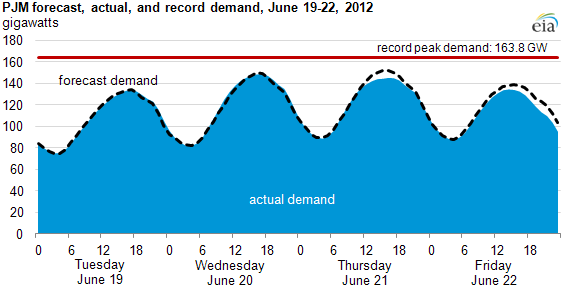
PJM's actual hourly demand on Wednesday, June 20, was a bit below the forecasted peak in the hour ending 5 p.m. The actual peak occurred in the hour ending 6 p.m. Demand was between 2 GW and 4 GW above forecast in the hours just before and after the super-peak hours of 3 p.m. to 7 p.m.
PJM forecast that Thursday, June 21, would have the highest peak during the heat wave. However, during the super-peak hours actual demand was as much as 7.5 GW below forecast. Peak hourly demand on June 21 was 3 GW less than the day before.
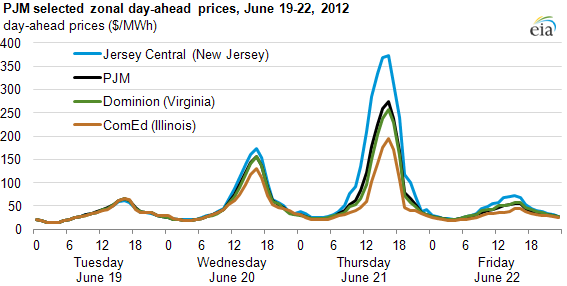
PJM's day-ahead prices were elevated on Wednesday, June 20, reflecting the expected increased demand. Day-ahead prices for Thursday, June 21, were even higher reflecting even higher expected demand.
The locational prices indicate some congestion during the high price hours. In PJM's Jersey Central (New Jersey) zone, day-ahead prices were higher than those in the Dominion (Virginia) zone and the ComEd (Illinois) zone on Thursday, June 21. For the PJM as a whole, day-ahead prices were midway between the Jersey Central and ComEd zonal prices.
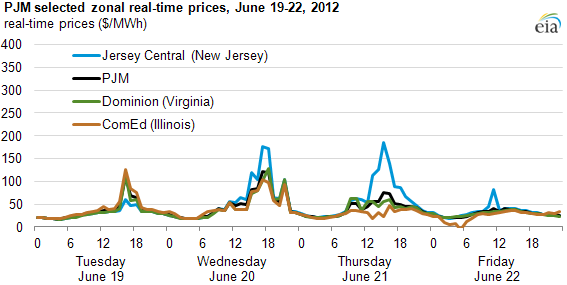
PJM's real-time prices on Wednesday, June 20 were about the same as the corresponding day-ahead prices in both magnitude and separation.
Real-time prices were much lower than day-ahead prices for Thursday, June 21. This is consistent with actual demand coming in below forecast demand on that day. The Jersey Central zone (New Jersey) real-time price did separate from the rest of PJM during the super-peak hours of 3 p.m. to 7 p.m., but it was about half of the day-ahead price.
New York Independent System Operator (NYISO)
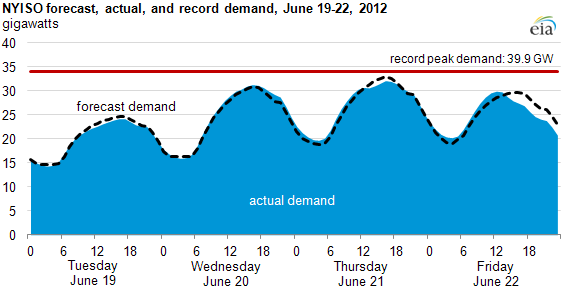
As forecast, NYISO's peak hour demand on Thursday, June 21, was its highest during the heat wave. Demand was forecast to peak at 97% of NYISO's all-time record peak. Actual demand came in at 95% of the record; actual demand turned out to be 95% of the record.
Actual demand was slightly above forecast on Tuesday, June 20, and below forecast on June 21.
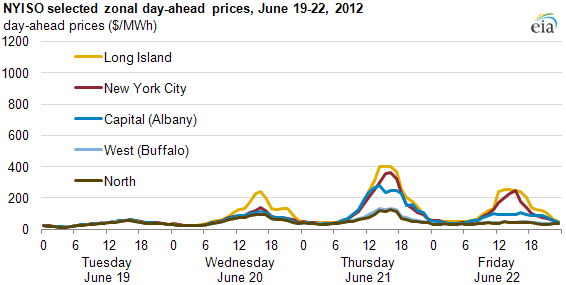
NYISO's day-ahead prices were elevated on Wednesday, June 20, reflecting the expected increases in demand. However, day-ahead prices for Thursday, June 21, were even higher, reflecting even higher expected demand.
The locational prices indicate some congestion during the high price hours. Long Island day-ahead prices broke away from the rest of the state on Wednesday, June 20. Day-ahead prices in Long Island, New York City, and Capital (Albany) zones were higher than the day-ahead prices for the North and West (Buffalo) zones on Thursday, June 21.
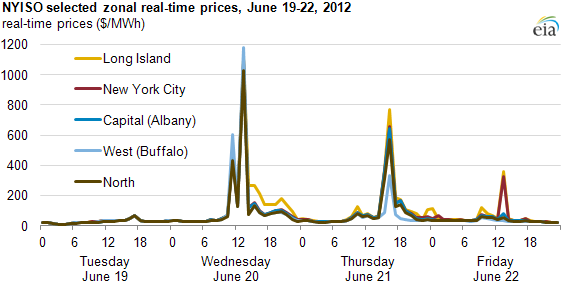
Real-time prices in NYISO's West (Buffalo) zone spiked to almost $1,200/MWh on Wednesday, June 20, with prices in other zones not far behind. This was well above the day-ahead prices for that day. The same was true on Thursday, June 21, but to a lesser extent.
NYISO's real-time prices on Thursday, June 21, were lower than the day before. This is consistent with actual demand coming in below forecast demand on June 21, even though the actual demand was higher on Thursday.
New England ISO (ISO-NE)
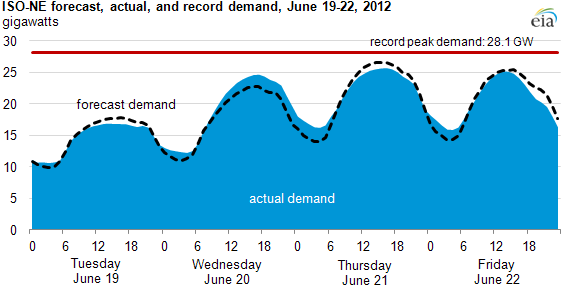
ISO-NE's actual peak demand was 8% over forecast of Wednesday, June 20. On Thursday, June 21, actual demand was 4% below forecast.
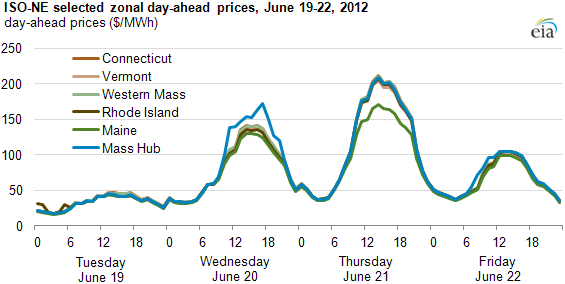
ISO-NE's day-ahead prices were elevated on Wednesday, June 20 reflecting the expected increased demand. Day-ahead prices for Thursday, June 21 were even higher reflecting even higher expected demand.
The locational prices indicate some congestion during the high price hours. Mass Hub prices broke away from the rest of the region on Wednesday, June 20. Day-ahead prices in Maine were lower than in the rest of ISO-NE on Thursday, June 21.
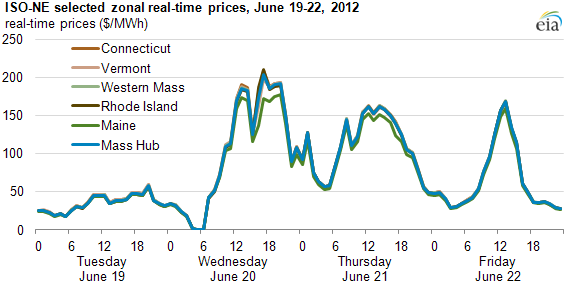
Real-time prices in ISO-NE West zone rose to over $200/MWh on Wednesday, June 20. This is slightly above the day-ahead prices for that day. This was consistent with actual demand coming in above forecast.
ISO-NE's real-time prices were lower than day-ahead prices for Thursday, June 21. This is consistent with actual demand coming in below forecast demand on that day. Unlike with day-ahead prices, there was very little price separation among zones in real-time.