U.S. Energy Information Administration logo
Skip to sub-navigation
July 10, 2012

Rising production in the Permian basin
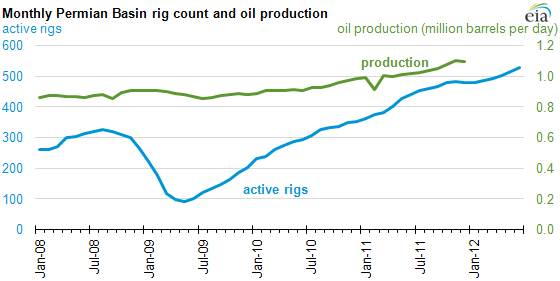
graph of Monthly Permian Basin rig count and oil production, as described in the article text
Sources: U.S Energy Information Administration, based on Baker Hughes and HPDI, LLC.
Notes: Graph includes rig counts through June 2012 and oil production through December 2011. Active rigs include rigs drilling for both crude oil and natural gas.

The source for the crude oil production data series published on July 10 was websites of the Railroad Commission of Texas and the New Mexico Energy, Minerals and Natural Resources Department. On July 11 the source was changed to HPDI, LLC, because HPDI, LLC collects both that data and production data that has not yet been processed by the Railroad Commission of Texas.

The Permian Basin—a long-time oil and natural gas producing region in west Texas and eastern New Mexico—is showing signs of new life. The active rig count has grown from 100 rigs in mid-2009 to over 500 rigs in May 2012. According to data from HPDI, oil production from the Permian has increased fairly steadily over the past few years, reaching the 1 million barrels per day (bbl/d) threshold in 2011—the first time since 1998.
graph of Spot prices of WTI and Midland crude oil, as described in the article text
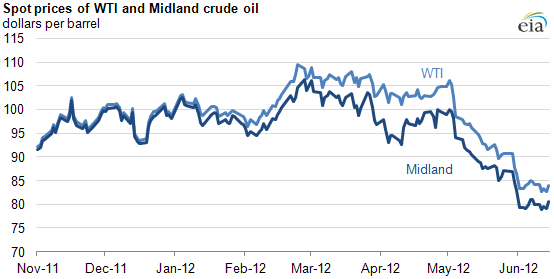
Sources: U.S. Energy Information Administration, based on Bloomberg.

Growing oil production in the Permian Basin and other Texas plays, most notably the Eagle Ford shale, may be starting to strain existing takeaway capacity and is creating a need for Texas oil to serve more distant refineries. While new pipeline projects are scheduled to come online, current transportation constraints have caused Permian crude oil, which is priced in Midland, Texas, to sell at a significant discount to WTI beginning in January 2012.

Statistics
Analysis
Tools
Education
News

Petroleum & Other Liquids

Crude oil, gasoline, heating oil, diesel, propane, and other liquids including biofuels and natural gas liquids.

Natural Gas

Exploration and reserves, storage, imports and exports, production, prices, sales.

Electricity

Sales, revenue and prices, power plants, fuel use, stocks, generation, trade, demand & emissions.

Coal

Reserves, production, prices, employment and productivity, distribution, stocks, imports and exports.

Nuclear & Uranium

Uranium fuel, nuclear reactors, generation, spent fuel.

Renewable & Alternative Fuels

Includes hydropower, solar, wind, geothermal, biomass and ethanol.

EIA Survey Forms

Forms EIA uses to collect energy data including descriptions, links to survey instructions, and additional information.

Total Energy

Comprehensive data summaries, comparisons, analysis, and projections integrated across all energy sources.

U.S. States

State energy information, including overviews, rankings, data, and analyses.

International

International energy information, including overviews, rankings, data, and analyses.

Environment

Greenhouse gas data, voluntary reporting, electric power plant emissions.

Data Tools, Apps, & Maps

Tools to customize searches, view specific data sets, study detailed documentation, and access time-series data.

Open Data

EIA's free and open data available as API, Excel add-in, bulk files, and widgets

EIA Beta

Come test out some of the products still in development and let us know what you think!

Open Source Code

EIA's open source code, available on GitHub.

RSS Feeds

Subscribe to feeds for updates on EIA products including Today in Energy and What's New.