
Most U.S. coal exports went to European and Asian markets in 2011
Download CSV Data
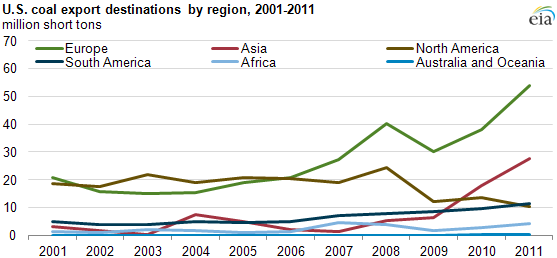
Coal exports to European and Asian markets represented 76% of total U.S. coal exports in 2011 (see chart above). While European markets have traditionally received a significant portion of U.S. coal exports, the share of coal exported to Asian markets is up since 2009 because of growth in sales to South Korea, China, and India. In 2011, total annual coal exports were up 31% compared to 2010, reaching 107 million short tons, due largely to rising exports to Europe and Asia.
Coal exports come in two forms: metallurgical coal, which can be used for steel production, and steam coal, which can be used for electricity generation. Metallurgical coal dominated U.S. coal exports in 2011 (see chart below); metallurgical coal exports totaled about 70 million short tons compared to about 38 million short tons for steam coal. Demand was high for metallurgical coal in European, Asian, and South American markets.
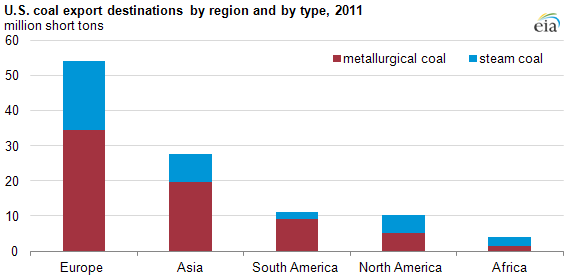
Note: In addition, the United Stated exported 333,503 short tons of steam coal (less than 1% of total steam coal exports) to Australia and Oceania collectively in 2011. The United States did not export metallurgical coal to this region.
Download CSV Data
Here is the coal export summary by region for 2011:
- Europe. The Netherlands (11 million short tons) and United Kingdom (7 million short tons) ranked in the top 10 destinations for both U.S. metallurgical coal exports and steam coal exports. Germany (5 million short tons), France (4 million short tons), and Belgium (3 million short tons) ranked among the top 10 U.S. steam coal destinations, while Italy (6 million short tons) and Ukraine (5 million short tons) ranked among the top 10 U.S. metallurgical coal destinations.
- Asia. South Korea (10 million short tons) ranked in the top 10 destinations for both U.S. metallurgical coal exports and steam coal exports. In fact, South Korea ranked first for U.S. steam coal destinations. Japan (7 million short tons), China (6 million short tons), and India (5 million short tons) ranked 3rd, 6th, and 9th, respectively, in the top 10 destinations for U.S. metallurgical coal exports.
- South America. Brazil (9 million short tons) ranked number 1 for U.S. metallurgical coal destinations, and Chile (2 million short tons) appeared on the list of top 10 U.S. steam coal destinations.
- North America. Steam coal exports to Canada and Mexico accounted for 12% of total steam coal exports in 2011. Canada also received 6% of total U.S. metallurgical coal exports.
- Africa. Morocco ranked 6th in the top 10 destinations for U.S. steam coal exports with 3 million short tons.
Several major factors contributed to the rise of U.S. coal exports in 2011. In general, coal use abroad continued to grow. U.S. coal exports helped to meet rising Asian demand and provided coal for other emerging markets. Falling domestic coal consumption (down 4.6% in 2011) along with a slight increase in U.S. coal production (0.9%) freed up more coal to export. A series of international coal supply disruptions in 2011 in traditional supply areas such as Australia, Indonesia, and Colombia meant that Asian countries needed to secure coal supplies from alternative markets. Rising spot natural gas prices in Europe, up about 35% in 2011, prompted European electricity generators to use more coal.
Tags: Africa, Australia, China, coal, consumption/demand, Europe, exports/imports, India