
Stable crude oil prices, increasing refinery margins in third quarter of 2025
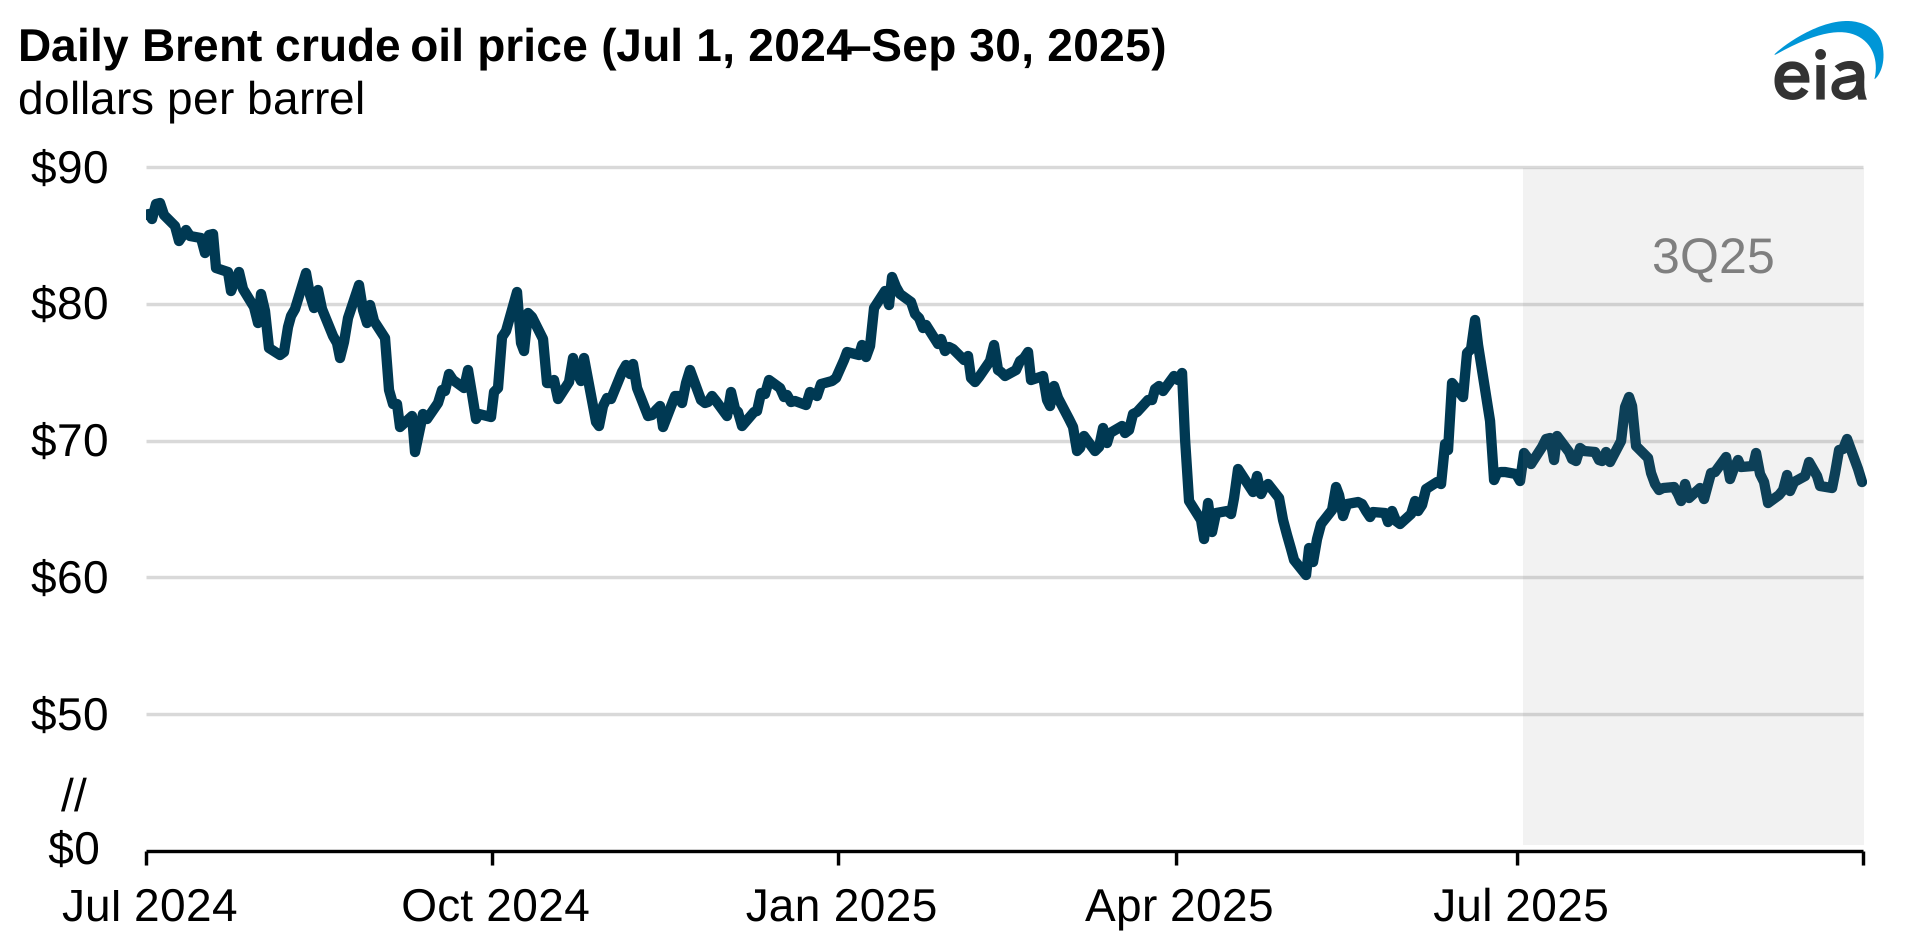
Note: 3Q25=third quarter of 2025
Crude oil prices were relatively stable in the third quarter of 2025 (3Q25), ending the quarter just 9 cents per barrel (b) less than they started, while refinery margins increased to their highest levels so far this year. In this quarterly update, we review petroleum markets price developments in 3Q25, covering crude oil prices and refinery margins.
Crude oil prices
The Brent crude oil price traded in a narrow range in 3Q25 as expected increased production from OPEC countries offset geopolitical tensions. The Brent price began the quarter averaging $70/b in July, following the Israel-Iran 12-day war at the end of 2Q25, before declining to an average of $67/b in August and $68/b in September.
OPEC+ announcements in July, August, and September to increase production put downward pressure on crude oil prices. Uncertainty related to global trade flows and potential macroeconomic impacts on petroleum consumption have also increased concerns of an oversupplied market. However, so far in 3Q25, increases to global crude oil supplies have not contributed to widespread increases in observable inventories. According to our Weekly Petroleum Status Report, U.S. crude oil inventories have remained closer to the five-year (2020–24) low than the five-year average.
Increased geopolitical risk offset downward price pressure from increased supply. In 3Q25, Russia increased attacks on Ukraine, and Ukraine successfully targeted Russia’s energy infrastructure. In August, the United States levied a 25% punitive tariff on India for purchasing Russia’s crude oil, raising total U.S. tariffs on the country to 50%. The European Union is planning additional punitive measures against processors of Russia’s crude oil following Russia’s military flights over Estonia, Poland, and Romania. In the Middle East, drone attacks by unknown saboteurs on oil fields in Iraq have contributed to rising regional risks as well. This tension comes alongside ongoing risks associated with continued military strikes between Israel and Hamas.
Refinery margins
Diesel crack spreads—a measure of the refinery margins for diesel—at New York Harbor reached a high of 85 cents per gallon (gal) in July, its highest level since February 2024 and almost double the crack spread from the same time last year. This rise was partly in response to elevated pressure from international markets as geopolitical tensions threatened supplies from Middle East refiners. These pressures eased going into August, and diesel crack spreads fell as low as 60 cents/gal, dropping below the previous five-year (2020–24) average. Diesel crack spreads began to climb slowly again in September. This climb partly reflects renewed international pressure on distillate markets following disruptions to Russia’s distillate production and a Russian ban on diesel exports following attacks on its refineries.
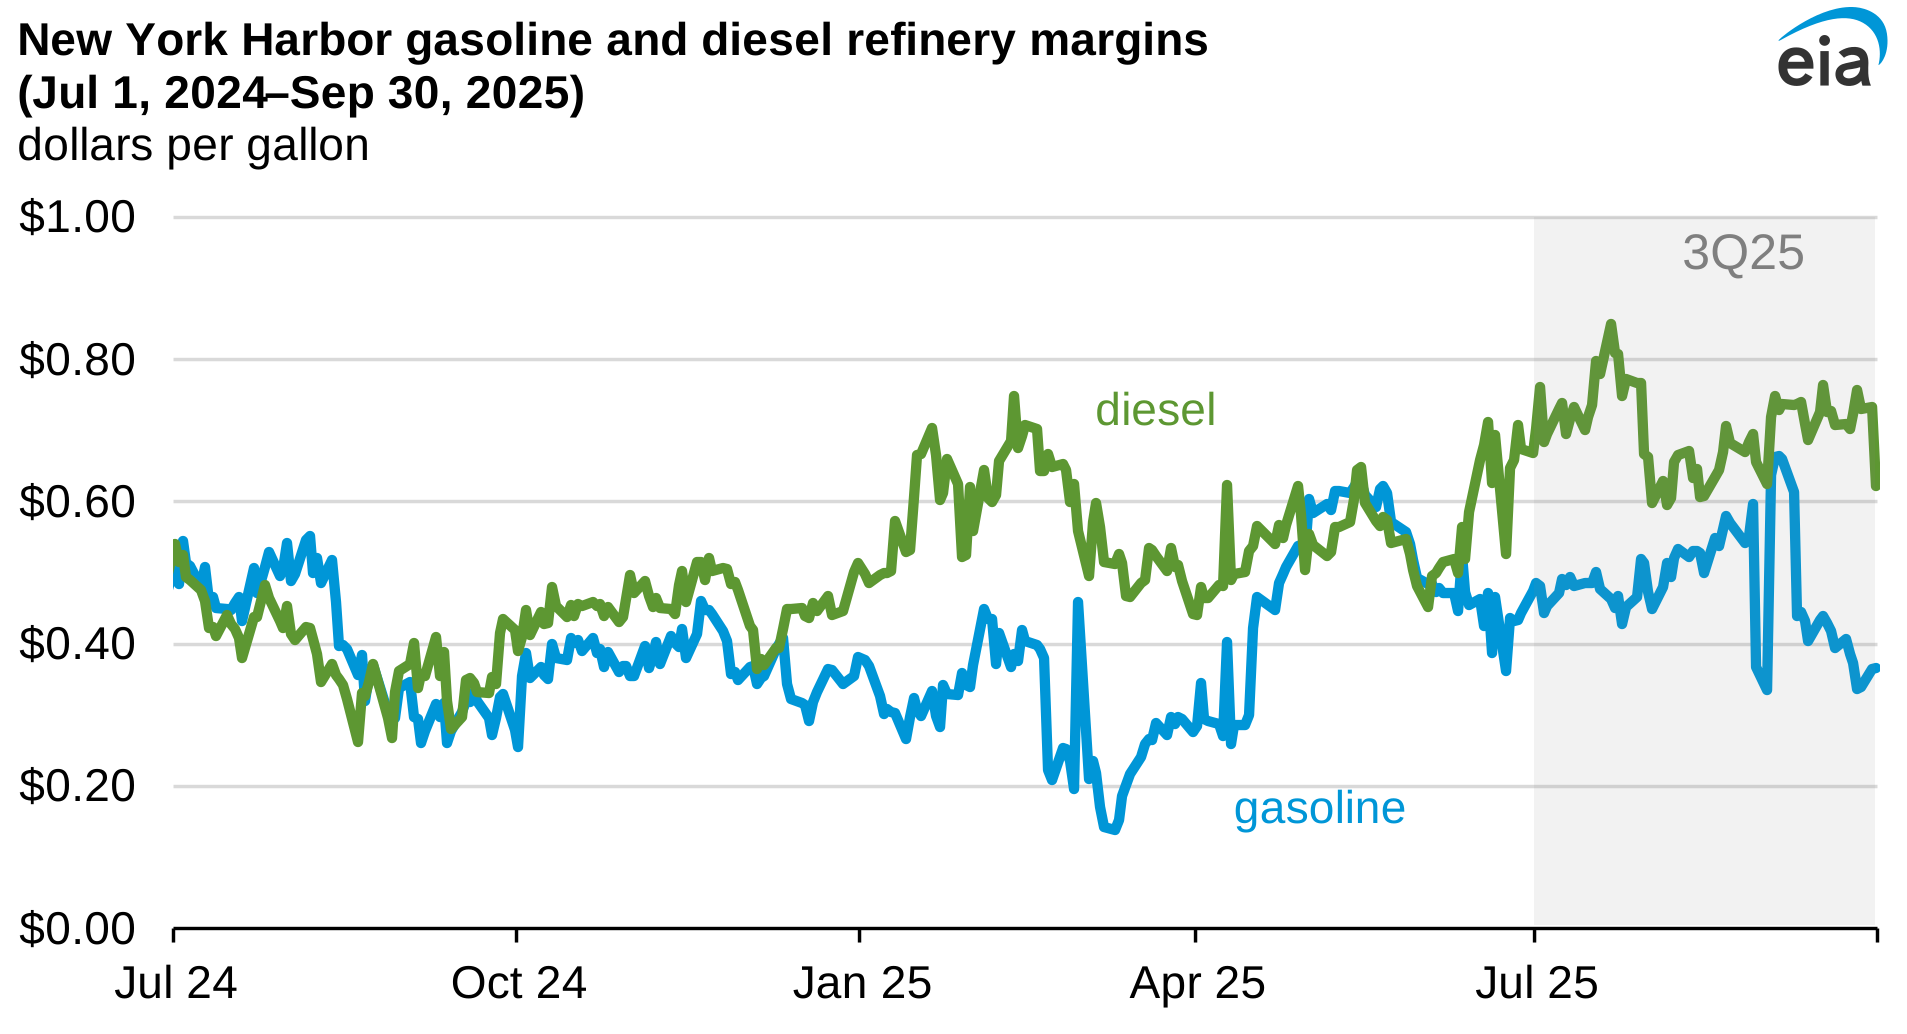
Note: The gasoline crack spread is the difference between the RBOB New York Harbor spot price and the Dated Brent Spot price. The diesel crack is the difference between the ultra-low sulfur diesel New York Harbor spot price and the Dated Brent Spot price. 3Q25=second quarter of 2025
Unlike distillate, refinery margins for gasoline began the quarter below the previous five-year (2020–24) average because of relatively high inventories on the East and West Coasts in July and early August. U.S. refinery margins for gasoline tend to decrease toward the end of summer, partly because of the shift from summer grade gasoline, which is more expensive to produce, to winter grade gasoline. This year, refinery margins decreased less than usual during the third quarter because of above-average motor gasoline inventory draws, bringing inventories below 2024 levels. In early September, gasoline crack spreads were more than double their level from the same time last year. As a result, the gasoline refinery margin exceeded its five-year average in mid-August for the first time since last April.
Principal contributors: Petroleum & Liquid Fuels Markets Team
Tags: crude oil, oil/petroleum, liquid fuels, prices, refineries, international