U.S. Energy Information Administration logo
Skip to sub-navigation
June 7, 2012

Northeast electricity markets react to hot weather in late May
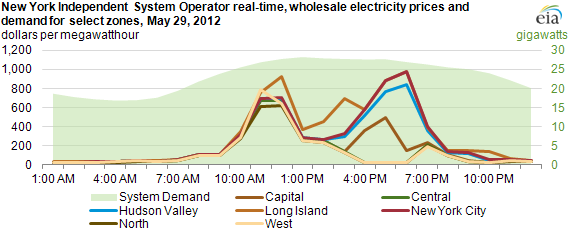
graph of New York Independent System Operator real-time wholesale electricity prices and demand for select zones, May 29, 2012, as described in the article text
Source: U.S. Energy Information Administration, based on New York Independent System Operator.
Note: Prices represent select NYISO zones.

Temperatures in and around New York and Pennsylvania were 10-20 degrees warmer than normal on Tuesday, May 29, lifting electricity demand above seasonal norms. Peak demand in the area served by the New York Independent System Operator (NYISO) was above 28 gigawatts (GW), about 18% below the all-time peak of 34 GW, but high enough to make real-time wholesale prices spike to almost $1,000 per megawatthour (MWh). Adjacent areas in New England and Pennsylvania also saw high real-time wholesale prices.

Many system operators price electricity using Locational Marginal Pricing (LMPs), which in real-time often reacts quickly to imbalances between supply and demand that can result from generator outages, temperature changes, and transmission constraints within the electric system.

Prices across NYISO increased in the earlier portion of the day, reflecting greater-than-expected demand. In the later portion of the day, the more typical pattern of prices spikes into New York City and Long Island reflects demand increases and transmission constraints associated with moving power to those load centers (see a previous Today in Energy article on congestion in the NYISO system).
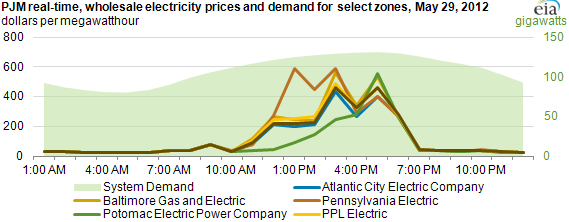
graph of PJM real-time wholesale electricity prices and demand for select zones, May 29, 2012, as described in the article text
Source: U.S. Energy Information Administration, based on PJM Interconnection.

The highest PJM real-time price occurred at the Pennsylvania Electric zone along the New York-Pennsylvania border, in the early afternoon, similar to the price spike in the New York ISO around the same time. Prices in the eastern regions of PJM (including Jersey City Power and Light and the Atlantic City Electric Company) peaked in the afternoon reflecting a typical pattern of constraints within the PJM system as temperatures peaked in the afternoon.
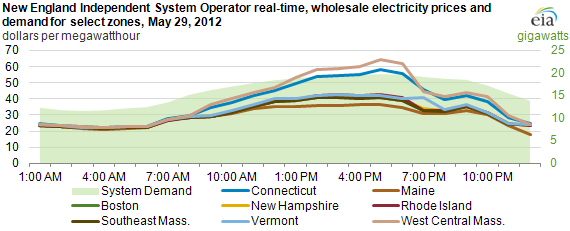
graph of New England Independent System Operator real-time wholesale electricity prices and demand for select zones, May 29, 2012, as described in the article text
Source: U.S. Energy Information Administration, based on New England Independent System Operator.

Although average hourly prices rose only slightly (see chart above) in ISO-New England on May 29, that region did see occasional five-minute prices as high as $500/MWh. Spikes in the five-minute prices drove hourly increases in the real-time market higher in Connecticut and West Central Massachusetts than in the rest of New England in the afternoon.

Statistics
Analysis
Tools
Education
News

Petroleum & Other Liquids

Crude oil, gasoline, heating oil, diesel, propane, and other liquids including biofuels and natural gas liquids.

Natural Gas

Exploration and reserves, storage, imports and exports, production, prices, sales.

Electricity

Sales, revenue and prices, power plants, fuel use, stocks, generation, trade, demand & emissions.

Coal

Reserves, production, prices, employment and productivity, distribution, stocks, imports and exports.

Nuclear & Uranium

Uranium fuel, nuclear reactors, generation, spent fuel.

Renewable & Alternative Fuels

Includes hydropower, solar, wind, geothermal, biomass and ethanol.

EIA Survey Forms

Forms EIA uses to collect energy data including descriptions, links to survey instructions, and additional information.

Total Energy

Comprehensive data summaries, comparisons, analysis, and projections integrated across all energy sources.

U.S. States

State energy information, including overviews, rankings, data, and analyses.

International

International energy information, including overviews, rankings, data, and analyses.

Environment

Greenhouse gas data, voluntary reporting, electric power plant emissions.

Data Tools, Apps, & Maps

Tools to customize searches, view specific data sets, study detailed documentation, and access time-series data.

Open Data

EIA's free and open data available as API, Excel add-in, bulk files, and widgets

EIA Beta

Come test out some of the products still in development and let us know what you think!

Open Source Code

EIA's open source code, available on GitHub.

RSS Feeds

Subscribe to feeds for updates on EIA products including Today in Energy and What's New.