Residential Energy Consumption Survey data show decreased energy consumption per household
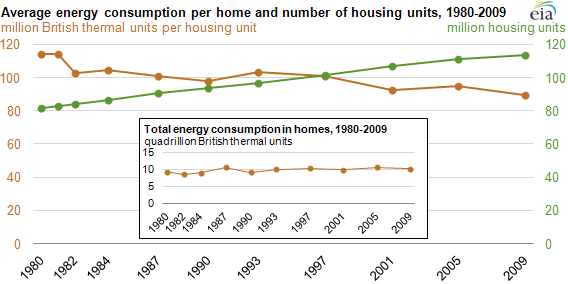
Note: Includes occupied, primary housing units only.
Total U.S. energy consumption in homes has remained relatively stable for many years as increased energy efficiency has offset the increase in the number and average size of housing units, according to the latest results from the Residential Energy Consumption Survey (RECS). The average household consumed 90 million British thermal units (Btu) in 2009, based on RECS data. This continues the downward trend in average per-household energy consumption of the last 30 years. Improvements in efficiency for space heating, air conditioning, and major appliances have all led to decreased consumption per household, despite increases in the number of homes, the average size of homes, and the use of electronics. Newer homes also tend to feature better insulation and other characteristics, such as double-pane windows, that improve the building envelope.
The larger sample size for the 2009 RECS allowed for the release of data and comparisons to be made for 16 individual states. For example, the average energy expenditure for a New Jersey household was $3,065, more than twice as much as the $1,423 for the average California household. The difference in these expenditures is mainly due to the higher demand for heating in New Jersey. The larger sample size also permits the release of data for more specific categories and provides a much greater level of precision for all estimates. Future analyses will discuss regional differences in fuels used, energy demand, weather, and electricity prices in the residential sector.
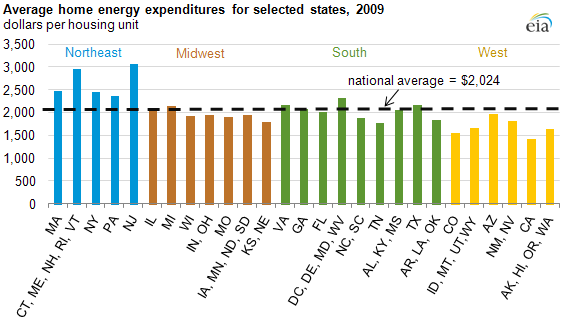
Notes: Graph includes occupied, primary housing units only. Expenditures reflect utility bills for fuels delivered to the residential sector. States are listed by postal code.
RECS characteristics data, released in early 2011, showed an increasing number of televisions, computers, and other electronic devices that add to household plug loads as well as the greater use of energy-efficient appliances. The first set of consumption and expenditures data tables, released this week, shows total and average energy consumption and expenditures by regional, structural, and demographic characteristics. The next RECS data release this summer will include energy use for each fuel and by specific end use.