Residential electricity bills could increase slightly this summer

Data values: U.S. Regional Electricity Sales to Ultimate Customers and U.S. Regional Electricity Prices to Ultimate Customers
During summer 2025, from June through September, residential customers in the United States can expect average monthly electricity bills of $178, a slight increase from last summer’s average of $173. We expect a slight decrease in consumption, driven by cooler forecast summer temperatures relative to last summer, which only partially offsets the expected increase in residential electricity prices in most areas of the country.
The number of cooling degree days (CDD), a measure of how hot the temperature is, affects the demand for electricity use for air conditioning. We expect that temperatures will be slightly cooler this summer with a 1% decline in total CDDs compared with summer 2024. The cooler expected weather contributes to slightly less U.S. residential summer electricity consumption, down less than 1% compared with last summer.
Weather remains the main source of uncertainty in our forecasts for summer residential electricity bills. If temperatures end up much hotter than expected, households are likely to face higher-than-expected increases in electricity bills, especially in the southern states.
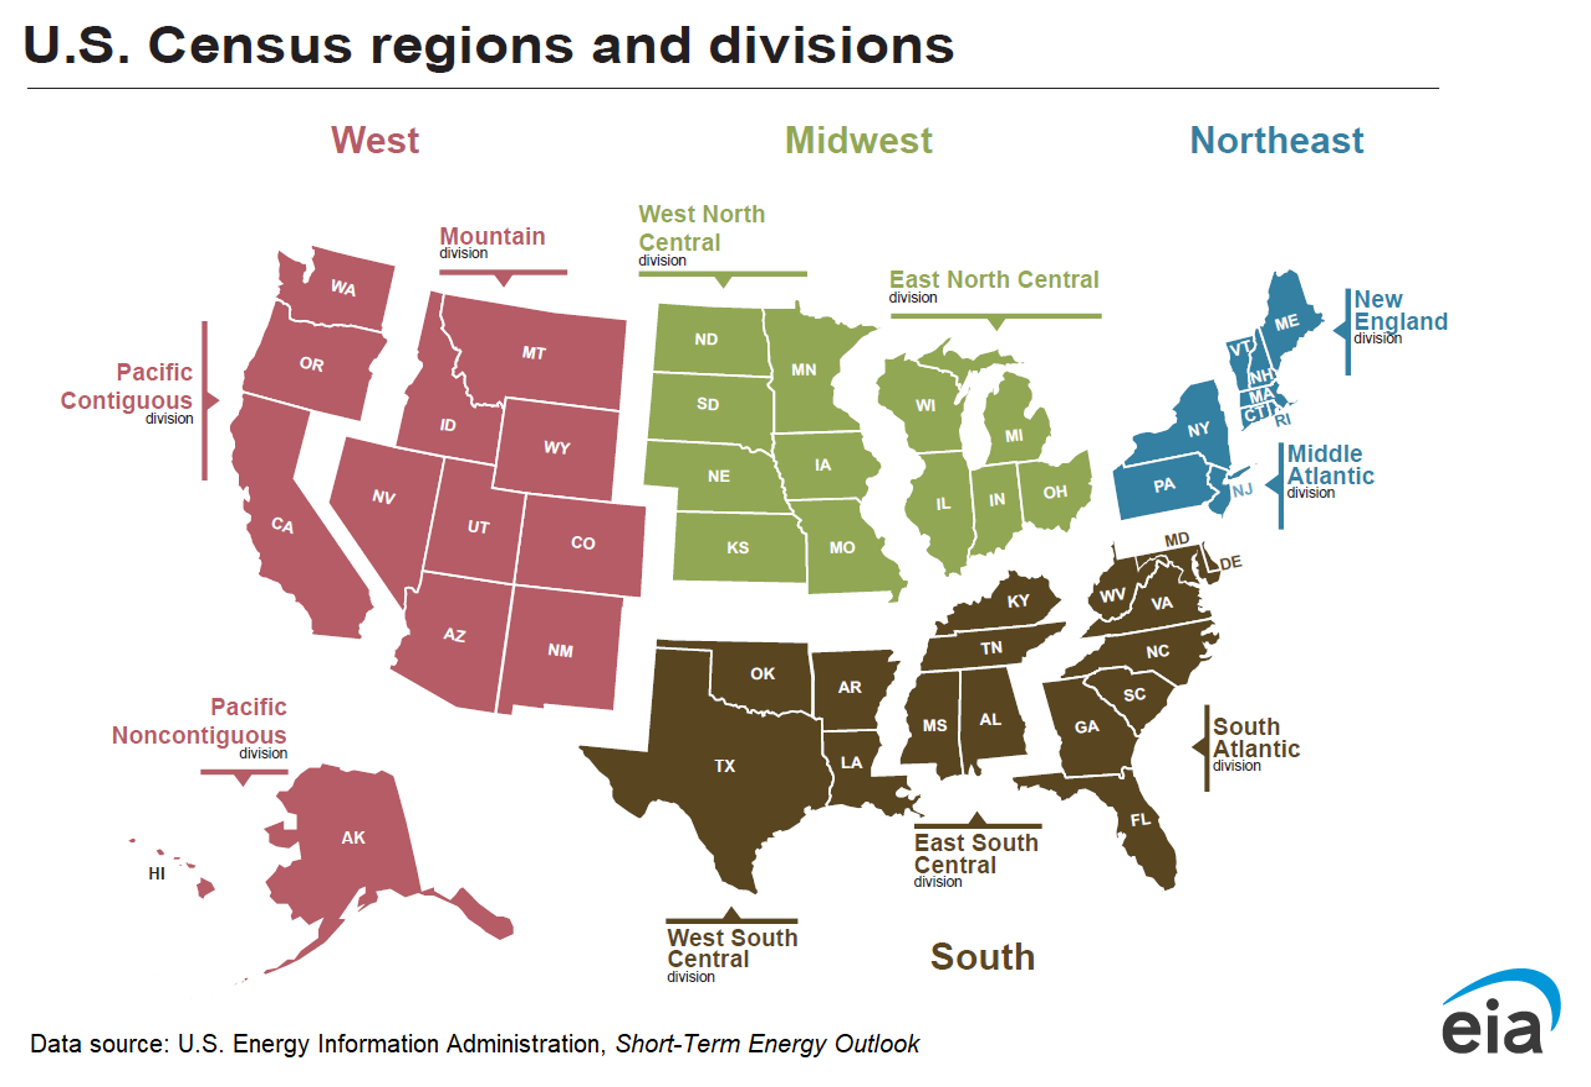
The impact of electricity consumption patterns and electricity prices on summer electricity bills will vary regionally. New England residential customers will likely experience the largest increase in average monthly electricity expenditures, with a forecast rise of $13 this summer compared with last summer.
In addition to the largest increase in expenditures, the New England and West South Central regions are expected to have the highest overall electricity bills this summer. Residential customers in the West South Central region tend to use a lot of air conditioning in the summer because of hot temperatures and high levels of humidity. Residential bills are higher in New England because the typical price per kilowatthour is higher than in other regions because the cost of natural gas delivered to power generators in that region tends to be higher than other areas of the country.
Residential customers in the South Atlantic and East South Central regions are likely to see small electricity bill increases, in line with last summer. We forecast monthly bills will increase slightly below the U.S. average in both of these regions.
Conversely, in the Mountain region and Pacific region, residential bills are expected to decrease because of lower consumption after near-record temperatures in the West during the summer of 2024. Price increases in those regions are relatively modest compared with recent years. Increased generation from hydropower in the western states this year should reduce the need to supply power from higher-cost natural gas generators.

Data values: U.S. Regional Electricity Sales to Ultimate Customers and U.S. Regional Electricity Prices to Ultimate Customers
Principal contributors: Tyler Hodge, Katherine Antonio