
Seasonal hydroelectric output drives down wholesale electricity prices in the West
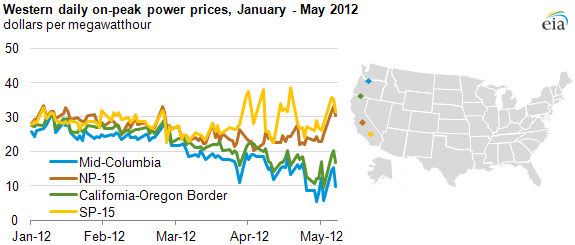
Note: SP-15 is a trading point for electric generation transactions in Southern California; NP-15 is a trading point for electric generation transactions in Northern California.
Increased hydroelectric output in the Pacific Northwest drove daily, on-peak prices of electricity below $10 per megawatthour in late April (see chart above) at the Mid-Columbia trading point on the border of Washington and Oregon. The availability of low-cost hydropower in the West also depressed prices at the California-Oregon border and helped offset prices that were up in northern California as a result of nuclear outages. High levels of hydroelectric output are a seasonal occurrence in the Pacific Northwest, with significant effects on electric power markets from Washington to California.
The Pacific Northwest has large amounts of hydroelectric capacity, and the variable cost of producing electricity from this capacity is minimal because there is no fuel cost. Consequently, when the water flows, large amounts of hydropower are generated, and wholesale electricity prices drop. But peak water flow is typically a seasonal event influenced by melting snowpack, so the price-reducing effect of hydropower normally lasts only a few months each year, typically in the spring and early summer (see chart below). The Bonneville Power Administration (BPA) operates the largest electric system in the Pacific Northwest, including most of the hydroelectric units.
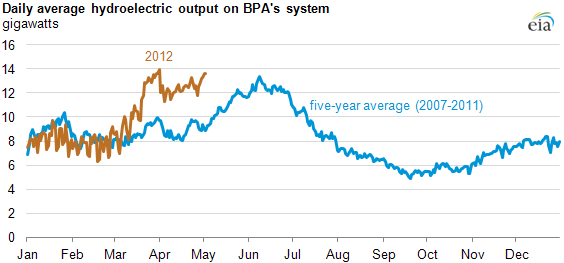
The increased hydroelectric output also helped moderate wholesale power prices at major electric power hubs in California, as significant levels of power from the Pacific Northwest flowed south. The combination of warm and wet weather in April and May in the Pacific Northwest melted low-elevation snow, filling hydroelectric dam reservoirs on the Columbia and Snake Rivers.
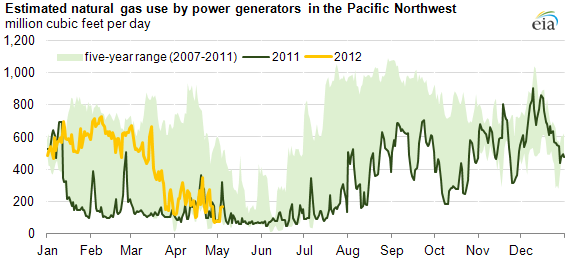
The relatively cheap electricity available from hydropower also displaced other sources of supply. Use of natural gas for power generation in the Pacific Northwest declined steeply in March as hydroelectric output increased.
Tags: California, capacity, electricity, generation, hydroelectric, natural gas, Northwest, Oregon, prices, Washington, weather