
Participation in electric net-metering programs increased sharply in recent years
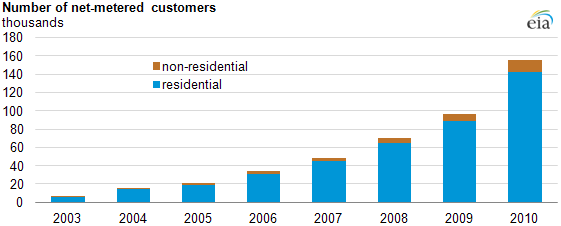
Note: The chart counts the number of net-metering customers and does not indicate the generator size or amount of generation. Non-residential includes the commercial and industrial sectors; net-metered generators in these sectors are typically larger than residential generators.
Electricity consumers are participating in net-metering programs in growing numbers. When individuals or businesses install small onsite generators (such as a rooftop solar system), they can usually enter into a net-metering agreement with their utility. Between 2003 and 2010, the average annual growth in customer participation was 56%, with a 61% increase between 2009 and 2010. While participation is increasing, electric customers with net metering represented only 0.1% of all customers in 2010.
State policies and technological developments led to an increase in residential and business consumers installing small-scale, on-site generators. Starting around the late 1990s, many states began incentive programs to encourage the installation of renewable generation (such as rebate programs, performance-based incentives, tax incentives, or low-interest loans), as well as Renewable Portfolio Standards. Tariffs standardizing aspects of net metering like compensation and interconnection rules—making it easier for consumers to participate—are also an important part of this state-based effort.
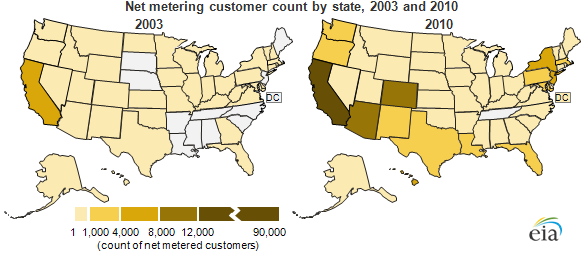
Since EIA began publishing data on the incidence of net metering in 2003, there has been growth in its application. In 2003, utilities in 38 states and the District of Columbia reported having a total of 6,813 net-metered customers. Over three quarters of those were in California with 5,242 customers; the next-largest state, Arizona, had only 330 customers.
In 2010, every state except for Tennessee reported net-metered customers. The total number of customers increased to 155,841, of which California accounted for 56% (86,495). The next largest states were Colorado (9,776), Arizona (8,559), New Jersey (7,526), and New York (5,638).
Net-metered installations were reported by 655 different investor-owned utilities, municipals, and cooperatives across the country, up from 127 in 2003. Residential applications made up 86% of total net-metered customers in 2003 and 91% in 2010.
The combination of onsite generation with net metering has benefits for both consumers and utilities:
- Consumer. Consumers benefit from lower utility bills and increased stability in expenses (by replacing some portion of changing monthly utility bill with payments on their generator system). Also, connecting an onsite generator to the grid means no backup storage is required, decreasing the capital investment.
- Utilities. Utilities can benefit by having units located closer to the end users, known as distributed generation, potentially requiring less investment in transmission and distribution infrastructure. Further, onsite generation can remove or defer the need for infrastructure expansion.
A previous Today in Energy article described the differences among state net-metering policies. Upcoming articles will examine some of the technologies used for, and the size of, net-metered installations in 2010, and take a closer look at States with particularly successful net-metering programs.