
Western U.S. hydropower generation fell to a 22-year low last year
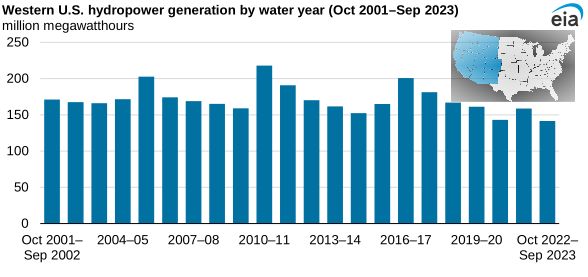
Note: The water year runs from October 1 to September 30.
According to preliminary data from our Electricity Data Browser, the least hydropower was generated in the western United States during the 2022–23 water year (October 1 through September 30) since at least 2001. Western region hydropower generation dropped by 11% from the previous water year to 141.6 million megawatthours (MWh). Hydropower generation in the western United States can vary significantly from year to year because the amount of precipitation influences generation.
Precipitation mostly accumulates in the fall and winter months in the form of snow at higher elevations. Snowpack accumulated during the winter serves as natural water storage that starts to melt in the springtime as temperatures gradually increase.
The western United States—Arizona, Colorado, Idaho, Montana, Nevada, New Mexico, Utah, Wyoming, California, Oregon, and Washington—produced most (60%) of the country’s hydroelectricity last water year (2022–23).
A combined 37% of total U.S. hydropower capacity is located in Washington and Oregon. Drought conditions last year affected these states and other states around the Columbia River Basin. These conditions contributed to historically low hydropower generation in these states.
During the fall and winter of 2022 into 2023, precipitation in this region was near-to-below normal. In May 2023, a heat wave that drove temperatures 30°F above normal affected the region, melting the snowpack rapidly. Water flows in May were high, but much of the water supply needed for generation during the summer months melted during the May heat wave. Water supply was below-average in the Northwest region for the rest of the water year, which reduced hydropower generation.
In the 2022–23 water year, 23% less hydropower was generated in Washington than the water year before, totaling 62.3 million MWh. Hydropower generation in Oregon also fell by more than 20% in the 2022–23 water year.
In contrast, hydropower generation grew in California last year. From December 2022 to March 2023, a series of atmospheric rivers drenched parts of the western United States, especially California, with record rain and snow.
Information from the California Department of Water Resources shows that last winter’s snowpack in the state was higher than any other reading since records began in the mid-1980s. The significant snowpack in the Sierra Nevada range helped replenish reservoirs after three consecutive years of drought in the state. California hydropower generation in the 2022–23 water year nearly doubled compared with the previous water year, totaling 30.0 million MWh.
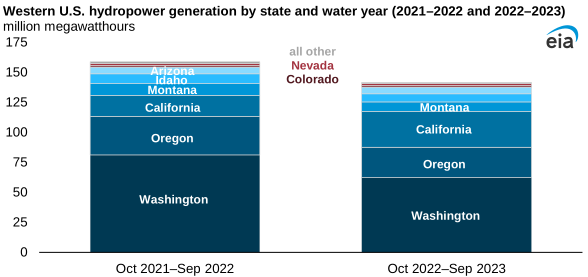
Other southwestern states also experienced above-normal precipitation. Lake Powell, which is formed by the Glen Canyon Dam, is considered an indicator of the hydrologic conditions in the Upper Colorado River Basin. Hydropower generation at the Glen Canyon Dam increased by 27% during water year 2022–23 compared with the water year before. However, water conservation efforts downstream at Lake Mead reduced water releases. The Hoover Dam, which forms Lake Mead, generated 11% less electricity in the 2022–23 water year than it did in the previous water year.
In our Short-Term Energy Outlook (STEO), we forecast hydropower generation for electricity market regions (rather than by state) and by calendar year (instead of by water year). In our latest STEO, we forecast 12% less hydropower production in the western market region of California, the Southwest, and the Northwest in 2024 than in 2023.
Principal contributors: Kimberly Peterson, Lindsay Aramayo
Tags: generation, electricity, Oregon, California, states, Arizona, hydroelectric, Washington