Wholesale electricity prices spike in Texas
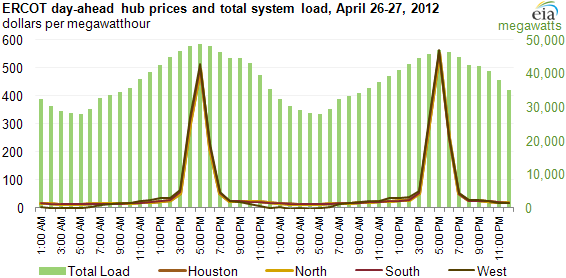
Notes: See map for regions. Overlapping regional prices show a lack of price separation at the time of peak across the regions, indicating minimal congestion on the transmission system.
Warmer-than-normal temperatures across Texas drove the hourly, day-ahead wholesale electricity prices between 5:00 p.m. and 6:00 p.m. on April 26 and 27 above $500 per megawatthour (MWh) in ERCOT, the electric system operator for most of Texas (see chart above). Very high prices for just part of an upcoming day, especially during "super peaks", can yield high average prices for the entire on-peak period.
Average day-ahead prices for on-peak power—covering weekdays from 7:00 a.m. to 11:00 p.m.—at the Houston price point rose to about $88/MWh on April 26 and April 27—a 135% increase from the day before (see chart below). Prices for on-peak power in ERCOT were about four times higher than most other major power markets during that week. ERCOT has established a cap of $3,000/MWh, which typically applies only to real-time prices.
Higher-than-normal temperatures drove significant increases in load levels starting in April of this year. The steep rise in daily peak loads from about 40,000 MWh to almost 50,000 MWh required more expensive generation to be brought online quickly to meet peak hourly demands (see chart below). This translated into high day-ahead average prices as operators included start-up costs in their bids to come back from outage periods. Electric power plant owners often conduct maintenance during April on power plants to ensure their readiness for peak demand periods during the middle of the summer. A similar but longer-lasting phenomenon happened in August 2011 as a result of hot weather coupled with limited peak operating reserves.
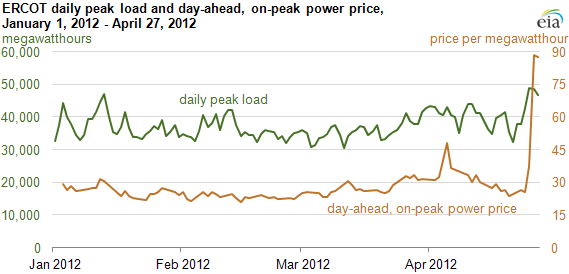
Notes: Day-ahead, on-peak price represented by Houston's price point. On-peak refers to the 16-hour time block from hours ending 7:00 a.m. to 10:00 p.m. CDT on weekdays, excluding NERC holidays.
ERCOT recorded high loads on April 26 and April 27 due to daily high temperatures that were up to 15 degrees hotter than normal. Temperatures throughout Texas were in the mid-80's to 90's (see maps below).
Tags: electricity, prices, Texas, weather, wholesale power, wholesale prices