
Heating U.S. commercial buildings is most energy intensive in cold climates
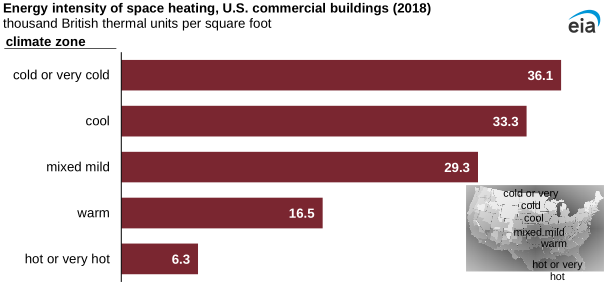
U.S. commercial buildings in cold or very cold climates were more than five times more energy intensive for space heating than buildings in hot or very hot climates, according to our latest Commercial Buildings Energy Consumption Survey (CBECS). Specifically, commercial buildings in cold or very cold climates consumed an average of 36,100 British thermal units per square foot, but buildings in hot or very hot climates consumed an average of 6,300 British thermal units per square foot.
The energy intensity for heating commercial buildings in the United States depends on the climate in which the building is located. The climate zones in our 2018 CBECS are based on the climate zones in ANSI/ASHRAE Standard 169-2021, Climatic Data for Building Design Standards. This standard designates climate zones using annual average temperature and precipitation data from 1994 to 2019.
Energy intensity in buildings is the energy consumed per square foot of floorspace. We calculate space heating energy-intensity estimates for CBECS by dividing the consumption of major fuels (electricity, natural gas, district heat, and fuel oil) for space heating by the total floorspace of the building that uses one of those fuels for space heating in each climate zone.
Commercial buildings in cooler climate zones were both more likely to be heated and to heat larger portions of their floorspace. In the cold or very cold climate zone, 62% of buildings reported heating all of their floorspace, but in the hot or very hot climate zone, 40% of buildings reported heating all of their floorspace.
Natural gas is the predominant energy source used for space heating in U.S. commercial buildings, accounting for 73% of the 2,167 trillion British thermal units of major fuels consumed for space heating in 2018. District heat accounted for the next-highest percentage of U.S. commercial space heating (12%), followed closely by electricity (11%). Fuel oil accounted for 4% of U.S. commercial space heating energy consumption. An additional 558,000 buildings (11% of U.S. commercial buildings with space heating) use other sources that aren’t included in major fuels consumption, such as propane and wood, for space heating.
The mixed mild climate zone had the lowest share of natural gas consumed for space heating in U.S. commercial buildings (68%) and the highest share of district heat consumed for space heating (18%). The hottest climate zone had the highest share of electricity consumed for space heating (18%), and the coldest climate zone had the highest share of fuel oil consumed for space heating (6%).
In 2018, furnaces were the most common heating equipment reported for heated commercial buildings in the cold or very cold climate zone (44%) and in the cool climate zone (47%). In contrast, packaged heating units were the most common heating equipment in mixed mild (40%), warm (58%), and hot or very hot climate zones (70%) among buildings that reported using energy for heating.
CBECS is the only nationally representative survey that collects information about U.S. building characteristics and energy use in commercial buildings. CBECS publishes a variety of data including building size, activity, energy sources, energy end uses, operating hours, and more.
The CBECS survey process spans more than four years, from developing the sample frame and survey questionnaire to releasing data to the public. Our final 2018 CBECS data were released in December 2022.
Principal contributors: Zack Marohl, Stacy Angel