
Prices and higher well productivity drive up U.S. crude oil production forecast
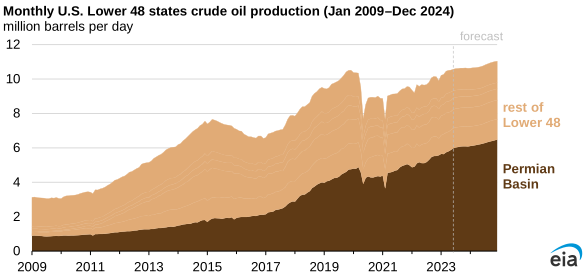
In our August Short-Term Energy Outlook (STEO), we increased our forecast for U.S. crude oil production in the Lower 48 states (L48) in 2023 and 2024 because of higher well productivity and higher forecast crude oil prices than we had previously expected.
In our August STEO, we forecast that crude oil production in the L48 in the second half of 2023 will average 10.6 million barrels per day (b/d), up 360,000 b/d from the July STEO. We increased our forecast L48 crude oil production for 2024 by 240,000 b/d from the July STEO to 10.8 million b/d.
Our U.S. crude oil production forecast increased even though rig counts have recently fallen. According to Baker Hughes, 520 oil-directed rigs were active in the United States during the week of August 18, 2023, an 81-rig decrease compared with the same week last year. However, increased well productivity has offset the decline in active rigs so far in 2023. In 2024, we expect the number of active rigs to increase, helping to grow crude oil production in the second half of the year.
Crude oil production in the Permian Basin is driving our forecast of L48 crude oil production growth. We forecast that production in the Permian Basin will increase by 430,000 b/d between January and December this year. This growth is more than our forecast total L48 production growth (410,000 b/d) during that period because production declines in other regions offset some of the forecast growth in the Permian Basin.
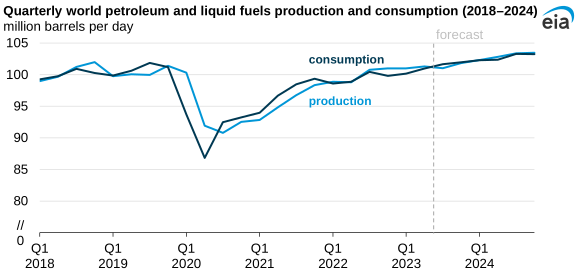
In the August STEO, we forecast that the price of Brent crude oil will average $87 per barrel (b) from August to December 2023, up from our July forecast of $79/b during that period. Crude oil prices increased primarily because of extended voluntary cuts to crude oil production in Saudi Arabia and our expectation of increased global demand. We expect the production cuts, combined with increasing demand, will cause global oil inventories to fall and put upward pressure on oil prices through the end of this year.
Note: Q=Quarter
We forecast that global stock draws will average 520,000 b/d in August 2023 and 1.4 million b/d in September 2023. We forecast average global stock draws of 120,000 b/d in the fourth quarter of 2023 will help sustain oil prices in the upper-$80s during that period. In 2024, we forecast that the global supply of petroleum and liquid fuels will closely match demand and the price of Brent will average $86/b.
Principal contributor: Matthew French
Tags: prices, states, crude oil, oil/petroleum