U.S. Energy Information Administration logo
Skip to sub-navigation
July 17, 2023

Natural gas storage injections exceed five-year average so far this summer
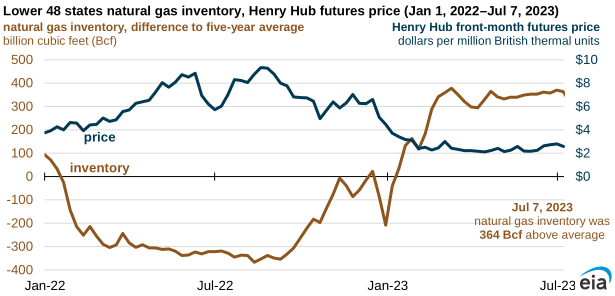
lower 48 states natural gas inventory, Henry Hub futures price
Data source: U.S. Energy Information Administration, Weekly Natural Gas Storage Report

Working natural gas inventories totaled 2,930 billion cubic feet (Bcf) in the Lower 48 states as of July 7, according to our Weekly Natural Gas Storage Report. U.S. natural gas production has outpaced demand, resulting in more natural gas injected into storage midway through the 2023 refill season (April 1–October 31). Since April 1, net injections into natural gas storage have exceeded the five-year (2018–22) average by 6% (66 Bcf), and working natural gas inventories have reached 69% of working gas capacity so far this refill season.

The increased surplus of working natural gas inventory has reduced natural gas prices during the first half of this year. Last summer, large deficits to the five-year average contributed to high natural gas prices, and the daily near-month futures price rose above $9.00 per million British thermal units (MMBtu) on several occasions. When the deficit to the five-year average eased late last summer, prices began to fall. Working natural gas stocks have been at a surplus to the five-year average since January 2023. This surplus reached a high in March and has remained above average since the start of refill season in April. Prices began to decline in January from an average of $5.53/MMBtu in December 2022 and have averaged below $2.50/MMBtu since February.
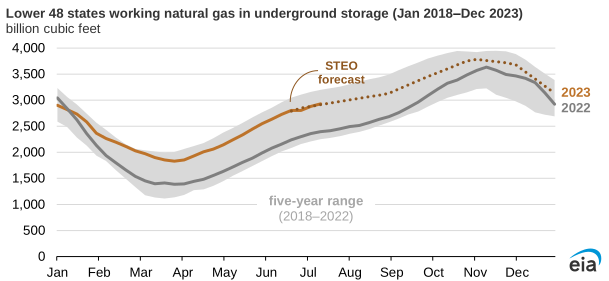
lower 48 states working natural gas in underground storage
Data source: U.S. Energy Information Administration, Weekly Natural Gas Storage Report and Short-Term Energy Outlook (STEO)

In our June Short-Term Energy Outlook, we forecast that storage injections will slow because of relatively flat natural gas production and increased natural gas use in the electric power sector to meet cooling demand for the remainder of the summer. Nevertheless, we expect working natural gas inventories to remain above the five-year average for the rest of the year.

Principal contributor: Jose Villar

Statistics
Analysis
Tools
Education
News

Petroleum & Other Liquids

Crude oil, gasoline, heating oil, diesel, propane, and other liquids including biofuels and natural gas liquids.

Natural Gas

Exploration and reserves, storage, imports and exports, production, prices, sales.

Electricity

Sales, revenue and prices, power plants, fuel use, stocks, generation, trade, demand & emissions.

Coal

Reserves, production, prices, employment and productivity, distribution, stocks, imports and exports.

Nuclear & Uranium

Uranium fuel, nuclear reactors, generation, spent fuel.

Renewable & Alternative Fuels

Includes hydropower, solar, wind, geothermal, biomass and ethanol.

EIA Survey Forms

Forms EIA uses to collect energy data including descriptions, links to survey instructions, and additional information.

Total Energy

Comprehensive data summaries, comparisons, analysis, and projections integrated across all energy sources.

U.S. States

State energy information, including overviews, rankings, data, and analyses.

International

International energy information, including overviews, rankings, data, and analyses.

Environment

Greenhouse gas data, voluntary reporting, electric power plant emissions.

Data Tools, Apps, & Maps

Tools to customize searches, view specific data sets, study detailed documentation, and access time-series data.

Open Data

EIA's free and open data available as API, Excel add-in, bulk files, and widgets

EIA Beta

Come test out some of the products still in development and let us know what you think!

Open Source Code

EIA's open source code, available on GitHub.

RSS Feeds

Subscribe to feeds for updates on EIA products including Today in Energy and What's New.