Daily natural gas and power price differences in Mid-Atlantic region reflect constraints
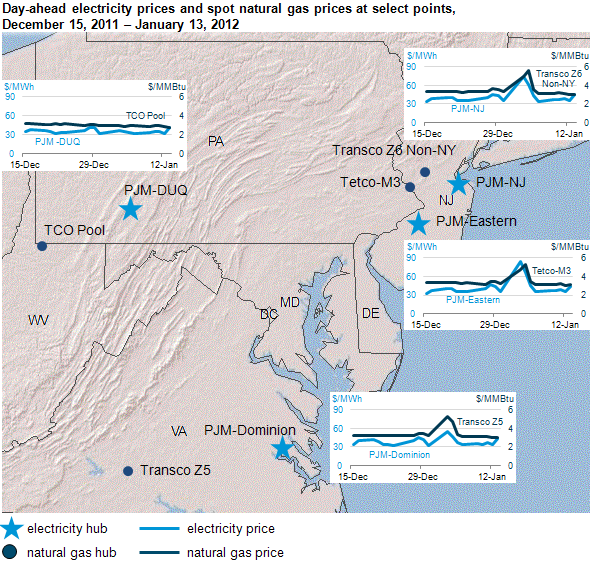
Note: Electricity prices are day-ahead, on-peak prices at points labeled above. Natural gas prices are spot gas prices at points labeled above. Daily data are displayed for December 15, 2011 to January 13, 2012.
Geographic price differences for U.S. natural gas and electricity prices can reflect transportation and/or transmission constraints between regional markets. A brief period of cold weather around January 4, 2012 drove increases in the price of natural gas and electricity across the East Coast. However, spot natural gas and power prices in western Pennsylvania were relatively unchanged.
The charts on the map above show day-ahead electricity prices and spot natural gas prices at several locations on the East Coast from December 15, 2011 to January 13, 2012. Prices along the East Coast increased due to a weather-induced rise in demand for electricity and natural gas for space heating. Despite experiencing a similar weather event, pricing points in western Pennsylvania were largely unaffected by it, mainly due to increases in natural gas infrastructure and increased natural gas supplies, especially from northern Pennsylvania.
Sudden geographic price differences that manifest during regional demand disturbances can be indicative of transportation and/or transmission constraints in a given market. On the natural gas side, pipeline capacity constraints during periods of high natural gas demand can result in a distinct price separation among regional markets, which translates into differences in spot power prices. Natural gas is often the fuel used by the highest-priced generator (the marginal generator). In Regional Transmission Organizations (RTOs), the price of the marginal generator, and thus the fuel it uses (the marginal fuel) is a key determinant of the price of electricity in the region.
The wholesale price of electricity is generally higher in New Jersey and Virginia than in other areas of the Mid-Atlantic region because of electric power transmission constraints that can inhibit the movement of lower-cost electricity from areas such as western Pennsylvania, especially when power demand is high to the east. This constraint often drives changes in real-time electricity prices as well.
Tags: electricity, map, natural gas, New Jersey, Pennsylvania, pipelines, prices, spot prices, states, transmission, transportation, weather