
Gasoline prices rise due to increased crude oil costs
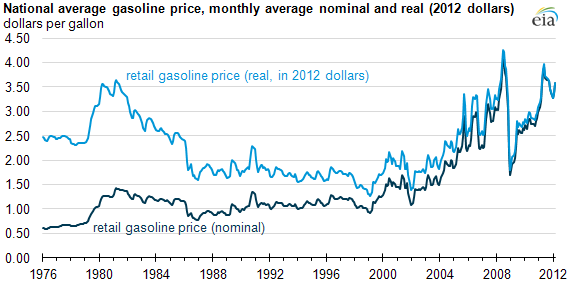
The national average price of regular grade gasoline averaged $3.58 per gallon for the month of February 2012, representing a 37-cent (11.5%) increase compared to February 2011 and an historic high for the month of February in both real and nominal prices (see chart above). However, as a result of vehicle fuel economy improvements, costs-per-mile-driven are not at record highs. Further, gasoline prices vary significantly by region, with average prices on the West Coast almost $1 per gallon more expensive than those in the Rocky Mountains. The seasonally-high retail prices are mostly a result of global crude oil prices, which have also been at record levels for this time of year.
In general, the level of gasoline prices is mostly a function of crude oil prices. Because crude oil is the main driver of gasoline prices, weak U.S. gasoline demand has not translated into lower costs at the pump. Crude oil prices are up in 2012. The price of Brent crude oil averaged $119.33 per barrel in February, the highest of any February on record. This average price was an increase of $15.61 per barrel compared to a year earlier, which (when translated into gallons) was also 37 cents per gallon, the same as the increase in retail gasoline prices.
In nominal terms, retail gasoline prices increased about 37 cents (11.5%) compared to the February 2011 average price of $3.21 per gallon, the previous nominal record. The increase was less steep when adjusted for inflation. In real terms, retail gasoline prices were up 8.9% compared to February 2011. The February 2012 price of $3.58 per gallon eclipsed the previous February record set in 1981.
However, compared to 1980, costs per mile driven are lower due to increased vehicle efficiency. Adjusted for inflation, costs per mile driven were about 23 cents in 1980. In February 2012, that number was estimated to be between 16 cents and 17 cents per mile (see chart below).
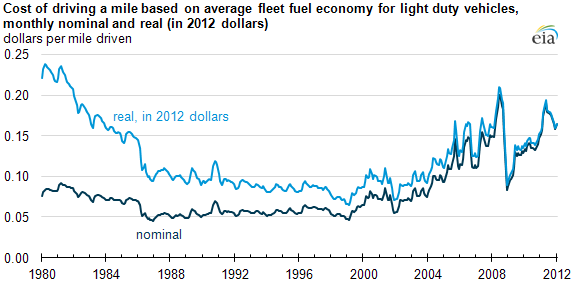
Note: Efficiency data are interpolated monthly values based on annual estimates in EIA's Annual Energy Outlook.
Download CSV Data
There is significant regional variation in gasoline prices. During 2012, retail gasoline prices in the Rocky Mountain region have been well below the national average due to lower crude oil input cost for refiners in that region. On March 12, the average price in the Rocky Mountain region was $3.48 per gallon. That was 74 cents per gallon lower than the average price on the West Coast, which was $4.22 per gallon on the same day. The West Coast has recently experienced a number of refinery outages that pushed up retail prices in the region. The national average price on March 12, 2012 was $3.83 per gallon.
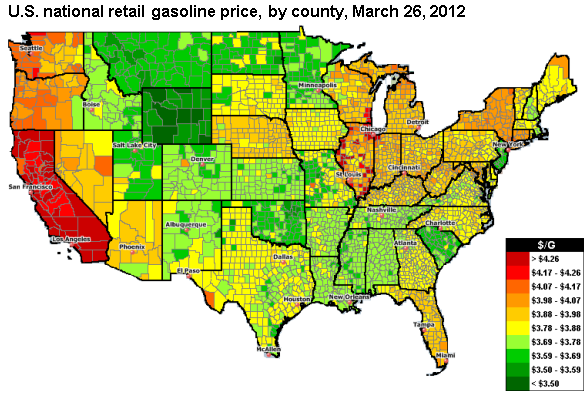
Note: GasBuddy.com is a group of local websites that offers an online method for website visitors to post and view recent retail gasoline prices.
Tags: crude oil, gasoline, oil/petroleum, prices