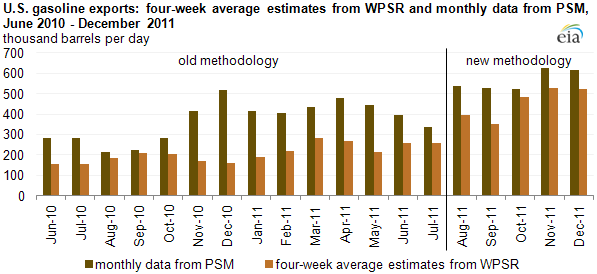
Updated weekly gasoline export estimates affect year-over-year gasoline demand comparisons
Download CSV Data
EIA's Weekly Petroleum Status Report (WPSR) collects weekly data on crude oil and product imports, stocks of crude and product, and refinery runs, but it does not collect data on product exports, which also affect weekly balances and estimates of "product supplied." Last August, EIA implemented a new methodology to improve the accuracy of the weekly gasoline export estimates. Consideration of the new export methodology substantially reduces the estimated decline in gasoline product supplied between January 2011 and January 2012.
EIA does not collect petroleum product export data on a weekly basis, relying instead on a model-based estimate using monthly data from the U.S. Census Bureau. Historically, U.S. petroleum product exports, including gasoline, have been relatively low compared to domestic consumption. From the mid-1990s through 2009, U.S. exports of gasoline rarely exceeded 200,000 barrels per day (bbl/d) and often did not vary significantly from month to month. However, driven by changes in world markets and global refining economics, U.S. gasoline exports began rising in 2010, and by December of that year, were two-thirds higher than those just one year earlier, an upward trend that continued into 2011.
After observing this over several months, EIA decided to move forward with a revamped methodology. EIA identified that the WPSR's model-based gasoline export estimate, using five years of monthly historical volumes and prices, needed revising to better reflect more current export market trends. For example, the WPSR's previous model-based, four-week average gasoline export estimate for January 2011 was only 191,000 bbl/d, or 223,000 bbl/d less than the 414,000 bbl/d of January gasoline exports data reported by the Census Bureau and published in the Petroleum Supply Monthly (PSM) in March 2011.
In August 2011, the WPSR began using the latest-available gasoline exports published in the PSM as the basis of its weekly gasoline export estimates, having determined it to be a better estimator. Because of this change in methodology, it is important that current comparisons to year-ago weekly gasoline demand, say for January 2011, account for the fact that actual exports at that time were later determined to have been 223,000 bbl/d higher than the previous WPSR January 2011 estimate, thereby lowering January 2011 weekly gasoline demand estimates by that same amount. While the new weekly gasoline export numbers are still estimates, the new methodology should provide a closer match with the final monthly data.
An important reason for EIA to improve the estimate of exports in the weekly data is that exports are subtracted when calculating domestic product supplied (used as a proxy for consumption). If exports are understated in the weekly data, then the product supplied estimates will be overstated by a similar amount. From the chart above, one can see that in January 2011, the WSPR initial gasoline export estimate was more than 200,000 bbl/d less than the more accurate export volumes later reported in the PSM. Without accounting for the new export estimate methodology in the WPSR, readers might conclude, for example, that U.S. gasoline demand in January 2012 declined by roughly 7% compared to January 2011 levels. However, accounting just for EIA's new weekly gasoline export model adopted last August would adjust WPSR-based year-ago comparisons of January 2012 gasoline demand down to roughly 4.3%. If estimates of exports are now overstated, the year-ago comparison would reflect an even smaller decline.