U.S. Energy Information Administration logo
Skip to sub-navigation
December 6, 2022

Product Highlight: EIA’s Hourly Electric Grid Monitor
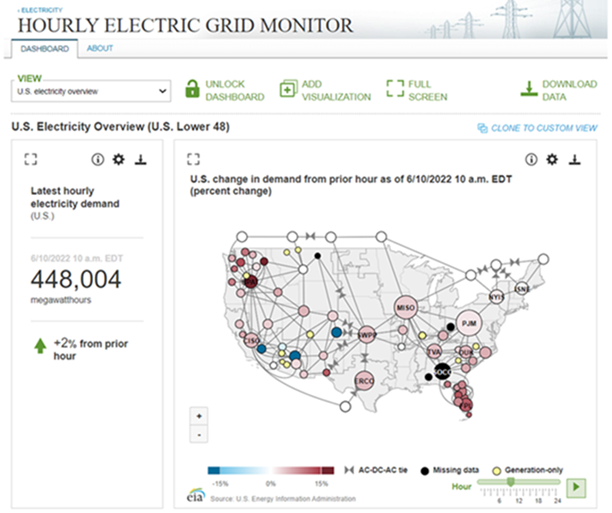
Hourly Electric Grid Monitor
Data source: U.S. Energy Information Administration, Hourly Electric Grid Monitor

Our Hourly Electric Grid Monitor provides up-to-the-hour information on electricity demand across the U.S. electric grid. Large-scale, planned or unplanned, events that affect normal routines, ranging from major holidays to the COVID-19 pandemic, can change the pattern of electricity usage in the country.

The electric grid monitor is updated every hour with electricity demand for the prior hour. Hourly demand forecasts are available every morning at about 10:00 a.m. eastern time for the current day. Hourly electricity generation and total interchange data are available with a one-day lag. Most of the grid monitor’s data are available dating back to July 1, 2015, except generation by energy source and subregional demand data, which dates back to July 1, 2018.

Hourly electricity data are a valuable resource for understanding the daily, weekly, seasonal, and regional usage patterns of electricity consumption in the United States. Divergence from typical consumption patterns shows the effect current events are having on the U.S. grid.

The biggest drivers of hourly electricity consumption in the United States are temperature, time of day, and day of week. Electricity demand is highest during the daytime in the summer, which tends to have a distinct single-peak load shape. During the winter, electricity demand typically has separate morning and evening peaks. During the spring and the fall, U.S. electricity demand can be particularly volatile when temperatures swing significantly. Weekend U.S. electricity demand tends to be lower than weekday demand because schools and many businesses are closed.

On the Hourly Electric Grid Monitor, you can create, save, and share custom dashboards to monitor developments in electricity markets.

Principal contributor: EIA Staff

Statistics
Analysis
Tools
Education
News

Petroleum & Other Liquids

Crude oil, gasoline, heating oil, diesel, propane, and other liquids including biofuels and natural gas liquids.

Natural Gas

Exploration and reserves, storage, imports and exports, production, prices, sales.

Electricity

Sales, revenue and prices, power plants, fuel use, stocks, generation, trade, demand & emissions.

Coal

Reserves, production, prices, employment and productivity, distribution, stocks, imports and exports.

Nuclear & Uranium

Uranium fuel, nuclear reactors, generation, spent fuel.

Renewable & Alternative Fuels

Includes hydropower, solar, wind, geothermal, biomass and ethanol.

EIA Survey Forms

Forms EIA uses to collect energy data including descriptions, links to survey instructions, and additional information.

Total Energy

Comprehensive data summaries, comparisons, analysis, and projections integrated across all energy sources.

U.S. States

State energy information, including overviews, rankings, data, and analyses.

International

International energy information, including overviews, rankings, data, and analyses.

Environment

Greenhouse gas data, voluntary reporting, electric power plant emissions.

Data Tools, Apps, & Maps

Tools to customize searches, view specific data sets, study detailed documentation, and access time-series data.

Open Data

EIA's free and open data available as API, Excel add-in, bulk files, and widgets

EIA Beta

Come test out some of the products still in development and let us know what you think!

Open Source Code

EIA's open source code, available on GitHub.

RSS Feeds

Subscribe to feeds for updates on EIA products including Today in Energy and What's New.