March 20, 2012
Refinery utilization rates react to economics in 2011
Source: U.S. Energy Information Administration, Refinery Utilization and Capacity.
Source: U.S. Energy Information Administration, Refinery Utilization and Capacity.
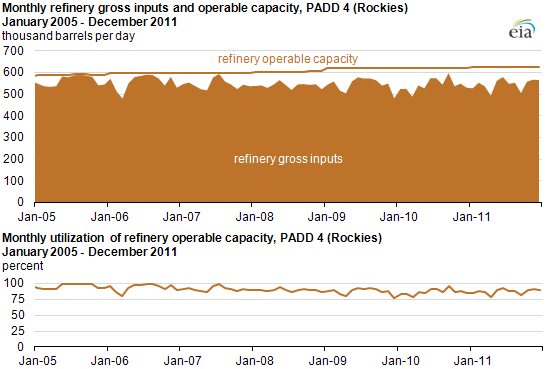
Source: U.S. Energy Information Administration, Refinery Utilization and Capacity.
Source: U.S. Energy Information Administration, Refinery Utilization and Capacity.
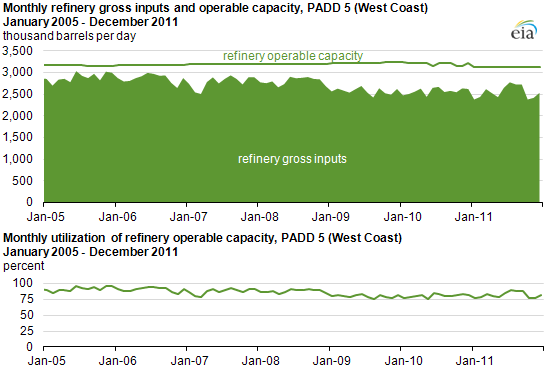
Source: U.S. Energy Information Administration, Refinery Utilization and Capacity.
Source: U.S. Energy Information Administration, Refinery Utilization and Capacity.
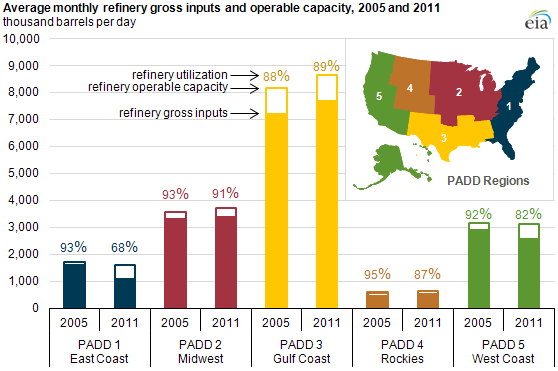
The divergence of West Texas Intermediate (WTI) and Brent crude oil prices in 2011 affected refinery utilization in the United States, particularly in the East Coast (PADD 1) and Midwest (PADD 2) regions. Historically, refineries in these districts operated at 80-90% of their capacity. Changes in refining economics last year contributed to real contrasts in refinery utilization in some of the PADDs (see Overview chart).
Some key findings by PADD include:
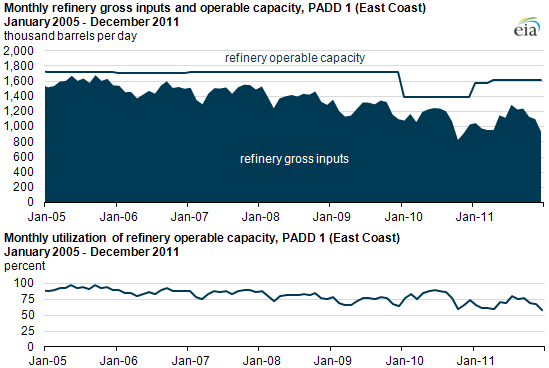
- PADD 1. East Coast refining typically relies on imports of crude oil based on the Brent crude price, which, on average, increased to a $16-per-barrel premium over WTI spot prices in 2011. As a result, two East Coast refineries idled capacity due to poor economics, while another is considering selling or shutting down. PADD 1 utilization averaged only 68% of operable capacity in 2011, which includes the idle capacity of closed refineries. This utilization rate reflects both the drop in East Coast refining capacity and lower crude oil inputs.
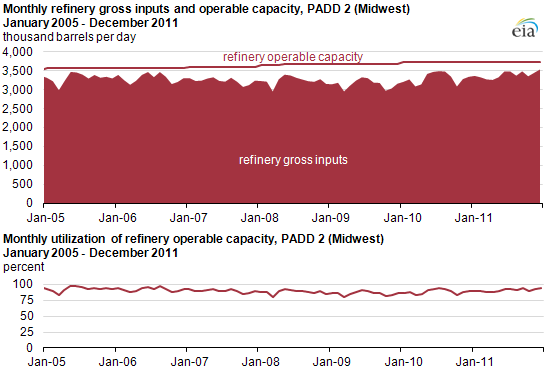
- PADD 2. Midwest refineries benefitted from supplies of less expensive crude oil coming from Canada and increased production in the Bakken formation. Thus, PADD 2 refineries averaged about 91% utilization in 2011, even with increased refining capacity. As a result, PADD 2 average crude oil inputs of nearly 3.4 million barrels per day were at the highest level since 2000.
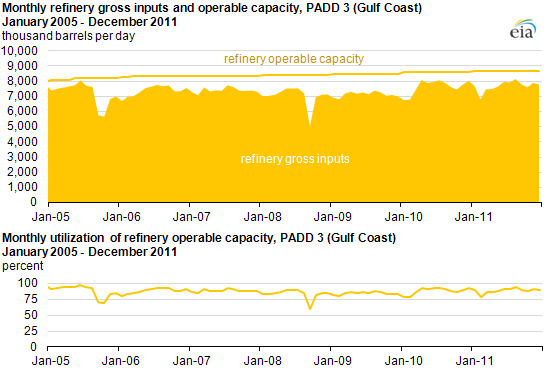
- PADD 3. Gulf Coast (PADD 3) continued capacity expansions as refineries upgraded infrastructure to maximize yields. Growing oil production in Texas and the Midwest contributed to increased inputs. The Gulf Coast refineries were able to use different types of crude oil to maximize production. Refineries in this region used cheaper sources of crude compared to the rest of the country.
- PADDs 4 and 5. Refinery closures, outages, and a lack of access to less expensive crude oil reduced inputs in 2011 to refineries in PADDs 4 and 5 and helped drive down utilization rates.