
Strong demand for diesel leads to high prices and tight inventories going into winter
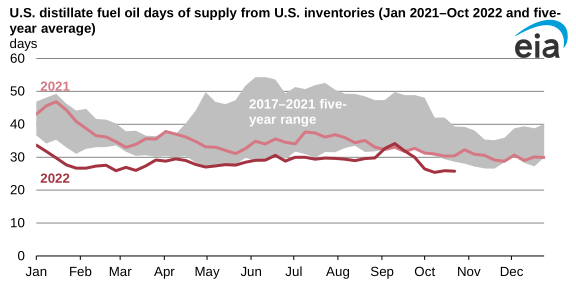
Note: Days of supply is calculated by dividing weekly ending inventories of distillate fuel oil by the rolling four-week average product supplied of distillate fuel oil for the corresponding week.
Strong demand for ultra-low sulfur diesel (ULSD) in October, combined with reduced global production, has resulted in lower ULSD inventories in the United States. ULSD is the most widely consumed form of distillate fuel oil.
Current inventories and our current estimate of future demand can be combined into a metric called days of supply, which is calculated by dividing the inventory (in barrels) by the estimated demand (in barrels per day) to get the number of days that inventories alone could meet demand. In October 2022, the United States had 25 days of supply of distillate, the fewest since 2008. U.S. days of supply between 2017 and 2021 averaged 34 days. U.S. inventories of distillate fuel oil have been below the previous five-year (2017–21) low since the start of 2022.
Days of supply, however, is not a complete snapshot of distillate fuel oil availability because it doesn’t take into account production, imports, or any sources of supply other than inventories.
In October 2022, the New York Harbor spot price for ULSD averaged $4.36 per gallon (gal), the highest monthly price since May 2022. The increase in diesel prices, both in the United States and globally, has been the result of a number of factors, such as tight global inventories, reduced refinery production in Europe following labor strikes, and the start of seasonal demand for distillate as a home heating fuel.
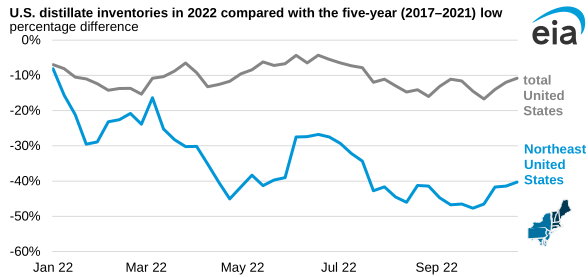
Reduced refining capacity in the United States and globally since 2020 is one of the main reasons for low distillate inventories in the United States. Distillate fuel consumption this year, through August, remained below pre-pandemic levels but was higher than in 2020. More distillate consumption combined with less distillate production contributed to the lower inventories. Increasing demand in October, measured as product supplied, contributed to greater pressure on those inventories and resulted in a decrease in October days of supply relative to September.
The Northeast—the combined New England and mid-Atlantic regions—has had even tighter inventories than the U.S. average. Lower inventories have contributed to rising prices in the region. U.S. distillate demand is seasonal; specifically, consumption increases in the winter because it is used for home heating, mostly in the Northeast.
You can read more about the seasonal nature of U.S. distillate demand in our Winter Fuels Outlook.
Principal contributor: Kevin Hack