
EIA expects production of global liquid fuels to outpace consumption in 2022
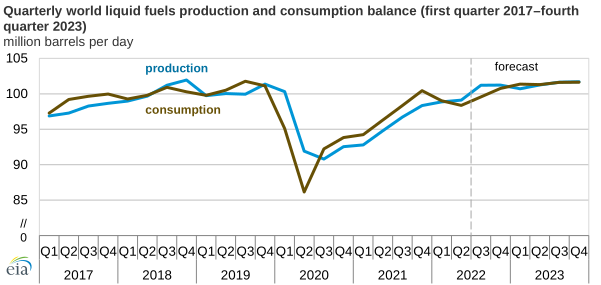
Changes to both production and consumption of global liquid fuels have changed our forecast for balances between the two for the rest of 2022 and 2023. For most of 2021, more liquid fuels were consumed globally than produced. Starting in the second quarter of 2022, global liquid fuels production rose above consumption. According to our August Short-Term Energy Outlook, we expect that during 2023, global supply and demand will be very closely matched. We forecast production in 2023 to average 101.3 million barrels per day (b/d) and consumption to average 101.5 million b/d.
When consumption of liquid fuels is higher than production, prices generally rise. When production is more than consumption, prices generally decline. Due to changes in supply and demand in mid-2022, we forecast that the price of Brent crude oil will average $105 per barrel (b) in 2022 and $95/b in 2023. The price of crude oil directly affects the price of petroleum products.
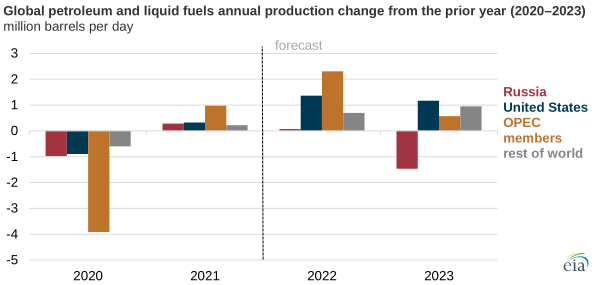
On the supply side, Russia produced more petroleum and other liquid fuels between May and July 2022 than we had previously expected, despite sanctions and independent corporate actions.
Additional sanctions on Russia, effective December 2022 and February 2023, have already been announced. We expect most of Russia’s crude oil and about half of its petroleum products that will become subject to EU sanctions are likely to be sold to other markets. The sanctions will become effective between December 2022 and February 2023. We expect Russia’s production to decline by 1.6 million b/d between the beginning of the fourth quarter of 2022 and the end of the first quarter of 2023.
We expect increased production in other parts of the world between now and the end of 2023 to push global petroleum and liquid fuels production to average 100.1 million b/d during 2022 and 101.3 million b/d during 2023.
We forecast that U.S. crude oil production will average 11.9 million b/d in 2022 and rise to a record 12.7 million b/d in 2023. Future OPEC production decisions will also affect global supply. We expect OPEC to set higher production targets in 2022 and 2023, but some OPEC member countries may not be able to meet higher production targets.
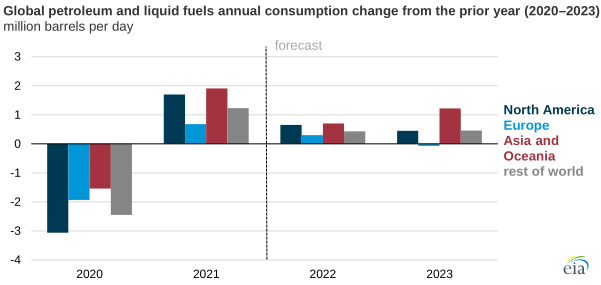
On the consumption side, consumer sentiment has been decreasing as inflation remains high and borrowing costs have been increasing due to rising interest rates.
The University of Michigan’s survey of consumer sentiment recorded its lowest reading on record in June, with data going back to November 1952. The survey showed that consumer sentiment began rising from its June low in July and August. Consumer sentiment in the Euro Area reached record lows in July.
Despite these factors that suggest downward pressure on petroleum and liquid fuels consumption, we expect global consumption to increase year-over-year during both 2022 and 2023. In 2021, global petroleum and liquid fuels consumption averaged 97.4 million b/d. We forecast that it will rise to average 99.4 million b/d for 2022 and to average 101.5 million b/d for 2023.
Principal contributor: Kimberly Peterson