
More than half of U.S. homes used a streaming device with their TVs in 2020
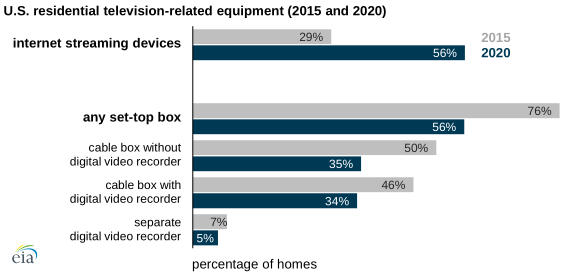
According to the most recent results from the Residential Energy Consumption Survey (RECS), 56% of U.S. homes used at least one internet streaming device with a TV in 2020—an increase from 29% in 2015. An equal percentage of U.S. homes, 56%, used at least one set-top box with a TV in 2020, which is a decline from 76% in 2015. About 27% of homes used both a streaming device and a set-top box in 2020, up from 21% in 2015.
An internet streaming device, or over-the-top streaming device, is an external device that enables a TV to stream internet content, such as Roku or Apple TV. Set-top boxes include cable or satellite boxes with or without digital video recording (DVR) technology as well as separate DVR boxes. These devices do not include gaming systems that stream content or smart TVs that have streaming applications.
Despite more people staying at home during the pandemic, RECS data on TV use show little change from 2015. In 2020, 72% of households with a TV reported using their most-used TV four or more hours per weekday, compared with 71% in 2015. The number of TVs used per household was also similar between 2015 and 2020, averaging 2.3 in both years.
In our survey, we asked respondents about the type and screen size of their TVs. U.S. households in 2020 reported owning more liquid crystal display (LCD) or light-emitting diode (LED) TVs than in earlier RECS studies. Among the most- and second-most-used TVs in U.S. homes, 89% were LED or LCD compared with 73% in 2015 and 37% in 2009. Respondents reported that only 3% of TVs in U.S. homes were projection or tube TVs in 2020. In 2009, 57% of the most-used TVs in homes were projection or tube TVs.
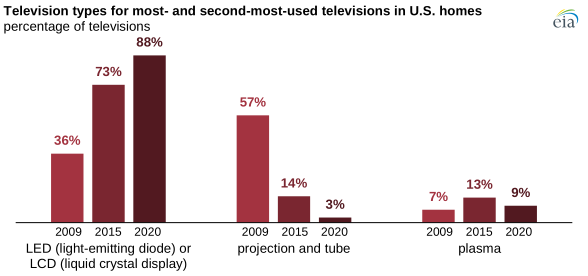
TV screen size also increased: 16% of the two most-used TVs in households during 2020 were 60 inches or larger compared with 7% in 2015. In 2020, 31% of TV screens were 39 inches or smaller, down from 46% of screens in 2015. LED and LCD TVs use less energy in both standby and active modes than plasma, projection, and tube TVs of the same size. Internet streaming devices, on average, also use less energy than set-top boxes. We expect to publish household consumption and expenditure data for selected end uses in early 2023.
The 2020 RECS collected data on household energy use from 18,496 households, the largest responding sample in the program’s history. Respondents completed the survey using self-administered web or mail questionnaires during late 2020 and early 2021. In addition to data on TVs and electronics, the initial 2020 RECS results include estimates on structural and geographic characteristics, lighting, appliances, demographic characteristics, and household energy insecurity. In the coming months, we plan to release estimates on additional topics and results detailing information for all 50 states and the District of Columbia.
Principal contributors: Francisco Cifuentes, Greg Lawson