
Review of developments in crude oil and product markets over the past two months
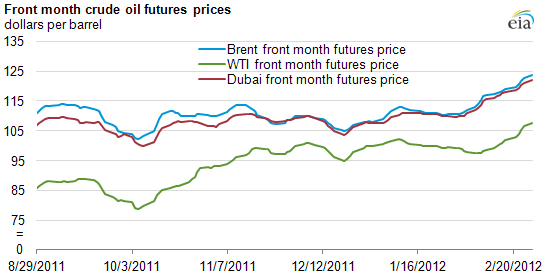
Note: Prices represent rolling 5-day averages.
On February 29, 2012, EIA released The Availability and Price of Petroleum and Petroleum Products Produced in Countries Other Than Iran, a 60-day recurring report required under Section 1245(d)(4)(A) of Public Law 112-81, the National Defense Authorization Act for Fiscal Year 2012. The Act requires that, not later than 60 days from enactment and every 60 days thereafter, the "Energy Information Administration, in consultation with the Secretary of the Treasury, the Secretary of State, and the Director of National Intelligence, shall submit to Congress a report on the availability and price of petroleum and petroleum products produced in countries other than Iran in the 60-day period preceding the submission of the report."
EIA estimates that the world oil market has become increasingly tight over the first two months of this year. Oil prices have risen since the beginning of the year and are currently at a high level. Global liquid fuels consumption is at historically high levels. While the economic outlook, especially in Europe, remains uncertain, continued growth is expected. Unusually cold weather in Europe contributed to tighter markets by increasing the demand for heating oil, particularly during February.
With respect to supply, the world has experienced a number of supply interruptions in the last two months, including production drops in South Sudan, Syria, Yemen, and the North Sea. Both the United States and the European Union (EU) have acted to tighten sanctions against Iran, including measures with both immediate and future effective dates.
Finally, spare crude oil production capacity, while estimated to be higher than during the 2003 to 2008 period, is quite modest by historical standards, especially when measured as a percentage of global oil production and considered in the context of current geopolitical uncertainties, including, but not limited to, the situation in Iran.
Crude oil prices have been generally rising over the past two months, particularly in recent weeks. This is reflected in price movements on the most commonly traded oil futures contracts. Comparing the 5-day periods ending December 30, 2011 and February 27, 2012, the price of the front month of the New York Mercantile Exchange (NYMEX) light sweet crude oil contract (WTI) rose from $99.77 per barrel to $107.66 per barrel. The Brent front month price, which is widely viewed as being more representative of global prices for light sweet crude oil, rose from $108.04 per barrel to $123.56 per barrel over the same period.
Gasoline prices have also generally been rising over the past two months, particularly in recent weeks. Reformulated blendstock for oxygenate blending (RBOB) is often traded instead of finished motor gasoline that already has been blended with ethanol, since oxygenate blending typically takes place at terminals along the distribution chain.
Comparing the 5-day periods ending December 30, 2011 and February 27, 2012, the price of the front month of the NYMEX RBOB contract, which calls for delivery in New York Harbor, rose from $2.68 per gallon to $3.11 per gallon. RBOB prices reflect pricing at the wholesale-level that do not include motor fuel taxes, or costs and profits associated with the distribution and retailing of gasoline. However, increases in RBOB prices are typically reflected in higher pump prices.
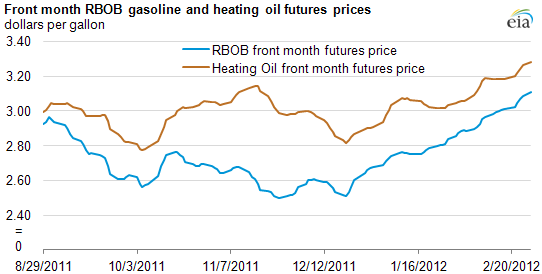
Notes: Prices represent rolling 5-day averages. Reformulated blendstock for oxygenate blending (RBOB) is often traded instead of finished motor gasoline that already has been blended with ethanol, since oxygenate blending typically takes place at terminals along the distribution chain.